OfsCredit OCCI full analysis,charts,indicators,moving averages,SMA,DMA,EMA,ADX,MACD,RSIOfs Credit OCCI WideScreen charts, DMA,SMA,EMA technical analysis, forecast prediction, by indicators ADX,MACD,RSI,CCI USA stock exchange
operates under N A sector & deals in N A
Daily price and charts and targets OfsCredit Strong Daily Stock price targets for OfsCredit OCCI are 4.49 and 4.78 | Daily Target 1 | 4.42 | | Daily Target 2 | 4.55 | | Daily Target 3 | 4.7133333333333 | | Daily Target 4 | 4.84 | | Daily Target 5 | 5 |
Daily price and volume Ofs Credit
| Date |
Closing |
Open |
Range |
Volume |
Mon 20 October 2025 |
4.67 (-2.51%) |
4.82 |
4.59 - 4.88 |
1.0888 times |
Fri 17 October 2025 |
4.79 (-0.62%) |
4.75 |
4.68 - 4.91 |
1.396 times |
Thu 16 October 2025 |
4.82 (-6.04%) |
4.99 |
4.73 - 5.01 |
3.0652 times |
Wed 15 October 2025 |
5.13 (-6.04%) |
5.31 |
5.12 - 5.33 |
1.3411 times |
Tue 14 October 2025 |
5.46 (-0.18%) |
5.46 |
5.40 - 5.48 |
1.019 times |
Mon 13 October 2025 |
5.47 (1.67%) |
5.42 |
5.40 - 5.50 |
0.4174 times |
Fri 10 October 2025 |
5.38 (-0.92%) |
5.45 |
5.37 - 5.47 |
0.3506 times |
Thu 09 October 2025 |
5.43 (-0.55%) |
5.49 |
5.39 - 5.50 |
0.4656 times |
Wed 08 October 2025 |
5.46 (0%) |
5.45 |
5.44 - 5.49 |
0.3463 times |
Tue 07 October 2025 |
5.46 (-1.44%) |
5.53 |
5.44 - 5.56 |
0.5101 times |
Mon 06 October 2025 |
5.54 (0%) |
5.54 |
5.50 - 5.59 |
0.5027 times |
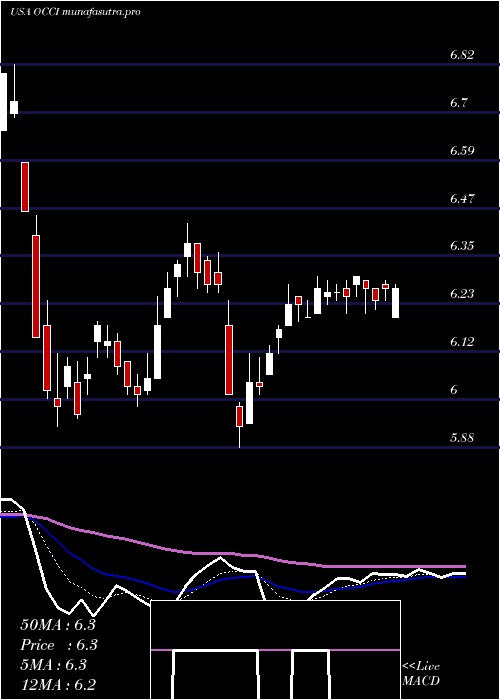
Weekly price and charts OfsCredit Strong weekly Stock price targets for OfsCredit OCCI are 4.49 and 4.78 | Weekly Target 1 | 4.42 | | Weekly Target 2 | 4.55 | | Weekly Target 3 | 4.7133333333333 | | Weekly Target 4 | 4.84 | | Weekly Target 5 | 5 |
Weekly price and volumes for Ofs Credit
| Date |
Closing |
Open |
Range |
Volume |
Mon 20 October 2025 |
4.67 (-2.51%) |
4.82 |
4.59 - 4.88 |
0.3933 times |
Fri 17 October 2025 |
4.79 (-10.97%) |
5.42 |
4.68 - 5.50 |
2.6147 times |
Fri 10 October 2025 |
5.38 (-2.89%) |
5.54 |
5.37 - 5.59 |
0.7857 times |
Fri 03 October 2025 |
5.54 (4.33%) |
5.36 |
5.21 - 5.63 |
1.2597 times |
Fri 26 September 2025 |
5.31 (-7.17%) |
5.70 |
5.30 - 5.71 |
1.0697 times |
Fri 19 September 2025 |
5.72 (-6.38%) |
5.98 |
5.71 - 6.03 |
1.0309 times |
Fri 12 September 2025 |
6.11 (2.35%) |
5.99 |
5.84 - 6.14 |
1.1343 times |
Fri 05 September 2025 |
5.97 (0%) |
5.94 |
5.85 - 6.02 |
0.7339 times |
Fri 29 August 2025 |
5.97 (0%) |
5.92 |
5.89 - 5.99 |
0.2633 times |
Fri 29 August 2025 |
5.97 (3.47%) |
5.74 |
5.72 - 5.99 |
0.7145 times |
Fri 22 August 2025 |
5.77 (1.05%) |
5.65 |
5.57 - 5.81 |
0.5206 times |
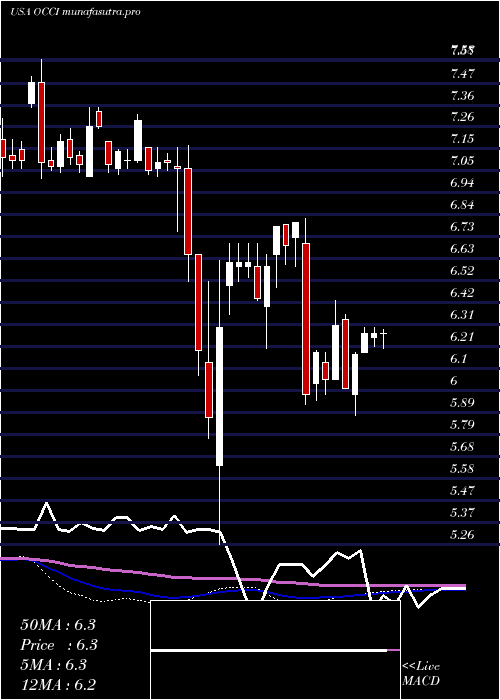
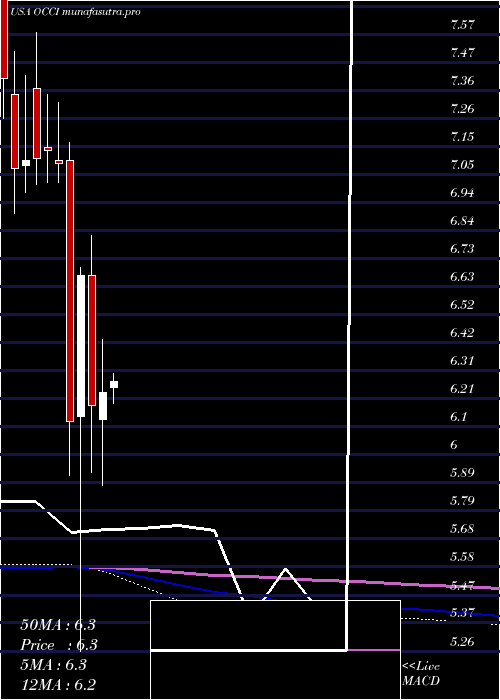
Monthly price and charts OfsCredit Strong monthly Stock price targets for OfsCredit OCCI are 4.11 and 5.15 | Monthly Target 1 | 3.92 | | Monthly Target 2 | 4.3 | | Monthly Target 3 | 4.9633333333333 | | Monthly Target 4 | 5.34 | | Monthly Target 5 | 6 |
Monthly price and volumes Ofs Credit
| Date |
Closing |
Open |
Range |
Volume |
Mon 20 October 2025 |
4.67 (-13.68%) |
5.40 |
4.59 - 5.63 |
0.9444 times |
Tue 30 September 2025 |
5.41 (-9.38%) |
5.94 |
5.21 - 6.14 |
0.9768 times |
Fri 29 August 2025 |
5.97 (-0.83%) |
6.03 |
5.37 - 6.04 |
1.0022 times |
Thu 31 July 2025 |
6.02 (-3.37%) |
6.25 |
5.77 - 6.30 |
0.8652 times |
Mon 30 June 2025 |
6.23 (0.81%) |
6.13 |
5.88 - 6.43 |
0.7828 times |
Fri 30 May 2025 |
6.18 (-7.35%) |
6.67 |
5.93 - 6.82 |
1.0026 times |
Wed 30 April 2025 |
6.67 (8.99%) |
6.14 |
5.26 - 6.70 |
1.1719 times |
Mon 31 March 2025 |
6.12 (-13.68%) |
7.10 |
5.92 - 7.17 |
1.4017 times |
Fri 28 February 2025 |
7.09 (-0.7%) |
7.10 |
7.02 - 7.32 |
0.9608 times |
Fri 31 January 2025 |
7.14 (0.42%) |
7.15 |
7.02 - 7.35 |
0.8915 times |
Tue 31 December 2024 |
7.11 (0.14%) |
7.37 |
7.01 - 7.58 |
0.6966 times |
DMA SMA EMA moving averages of Ofs Credit OCCI
DMA (daily moving average) of Ofs Credit OCCI
| DMA period | DMA value | | 5 day DMA | 4.97 | | 12 day DMA | 5.26 | | 20 day DMA | 5.33 | | 35 day DMA | 5.58 | | 50 day DMA | 5.65 | | 100 day DMA | 5.87 | | 150 day DMA | 6.08 | | 200 day DMA | 6.34 | EMA (exponential moving average) of Ofs Credit OCCI
| EMA period | EMA current | EMA prev | EMA prev2 | | 5 day EMA | 4.92 | 5.04 | 5.17 | | 12 day EMA | 5.17 | 5.26 | 5.34 | | 20 day EMA | 5.3 | 5.37 | 5.43 | | 35 day EMA | 5.43 | 5.48 | 5.52 | | 50 day EMA | 5.59 | 5.63 | 5.66 |
SMA (simple moving average) of Ofs Credit OCCI
| SMA period | SMA current | SMA prev | SMA prev2 | | 5 day SMA | 4.97 | 5.13 | 5.25 | | 12 day SMA | 5.26 | 5.34 | 5.39 | | 20 day SMA | 5.33 | 5.37 | 5.42 | | 35 day SMA | 5.58 | 5.62 | 5.65 | | 50 day SMA | 5.65 | 5.67 | 5.68 | | 100 day SMA | 5.87 | 5.88 | 5.9 | | 150 day SMA | 6.08 | 6.1 | 6.11 | | 200 day SMA | 6.34 | 6.35 | 6.36 |
|
|
