OwensCorning OC full analysis,charts,indicators,moving averages,SMA,DMA,EMA,ADX,MACD,RSIOwens Corning OC WideScreen charts, DMA,SMA,EMA technical analysis, forecast prediction, by indicators ADX,MACD,RSI,CCI USA stock exchange
operates under Capital Goods sector & deals in Industrial Machinery Components
Daily price and charts and targets OwensCorning Strong Daily Stock price targets for OwensCorning OC are 110.26 and 113.45 | Daily Target 1 | 109.67 | | Daily Target 2 | 110.84 | | Daily Target 3 | 112.86333333333 | | Daily Target 4 | 114.03 | | Daily Target 5 | 116.05 |
Daily price and volume Owens Corning
| Date |
Closing |
Open |
Range |
Volume |
Thu 04 December 2025 |
112.00 (-1.86%) |
114.22 |
111.70 - 114.89 |
0.5716 times |
Wed 03 December 2025 |
114.12 (1.44%) |
112.54 |
111.97 - 116.00 |
0.7157 times |
Tue 02 December 2025 |
112.50 (-1.06%) |
114.02 |
111.56 - 114.15 |
0.7408 times |
Mon 01 December 2025 |
113.70 (0.41%) |
111.66 |
111.05 - 115.17 |
0.601 times |
Fri 28 November 2025 |
113.24 (1.51%) |
111.55 |
110.97 - 113.96 |
0.3827 times |
Wed 26 November 2025 |
111.56 (2.09%) |
108.31 |
107.95 - 112.93 |
0.7165 times |
Tue 25 November 2025 |
109.28 (4.03%) |
106.96 |
106.00 - 110.04 |
0.7845 times |
Mon 24 November 2025 |
105.05 (0.81%) |
102.34 |
101.16 - 106.75 |
3.9425 times |
Fri 21 November 2025 |
104.21 (6.03%) |
99.15 |
98.58 - 105.38 |
0.8668 times |
Thu 20 November 2025 |
98.28 (-0.89%) |
99.89 |
97.53 - 100.99 |
0.6778 times |
Wed 19 November 2025 |
99.16 (0.11%) |
99.53 |
98.35 - 100.00 |
0.6571 times |
Weekly price and charts OwensCorning Strong weekly Stock price targets for OwensCorning OC are 111.53 and 116.48 | Weekly Target 1 | 108.07 | | Weekly Target 2 | 110.03 | | Weekly Target 3 | 113.01666666667 | | Weekly Target 4 | 114.98 | | Weekly Target 5 | 117.97 |
Weekly price and volumes for Owens Corning
| Date |
Closing |
Open |
Range |
Volume |
Thu 04 December 2025 |
112.00 (-1.1%) |
111.66 |
111.05 - 116.00 |
0.9038 times |
Fri 28 November 2025 |
113.24 (8.67%) |
102.34 |
101.16 - 113.96 |
2.0027 times |
Fri 21 November 2025 |
104.21 (2.34%) |
101.39 |
97.53 - 105.38 |
1.2691 times |
Fri 14 November 2025 |
101.83 (-2.27%) |
103.59 |
100.50 - 106.14 |
1.2884 times |
Fri 07 November 2025 |
104.20 (-18.15%) |
123.00 |
103.05 - 123.07 |
1.4902 times |
Fri 31 October 2025 |
127.31 (0%) |
124.74 |
123.98 - 127.42 |
0.1832 times |
Fri 31 October 2025 |
127.31 (-0.34%) |
127.82 |
123.02 - 129.00 |
0.7685 times |
Fri 24 October 2025 |
127.74 (0.61%) |
126.93 |
126.02 - 132.52 |
0.8436 times |
Fri 17 October 2025 |
126.96 (-4.81%) |
127.63 |
123.23 - 131.11 |
0.9768 times |
Tue 07 October 2025 |
133.38 (-3.85%) |
139.79 |
132.66 - 139.79 |
0.2737 times |
Fri 03 October 2025 |
138.72 (-3.07%) |
143.74 |
138.30 - 144.04 |
0.7018 times |
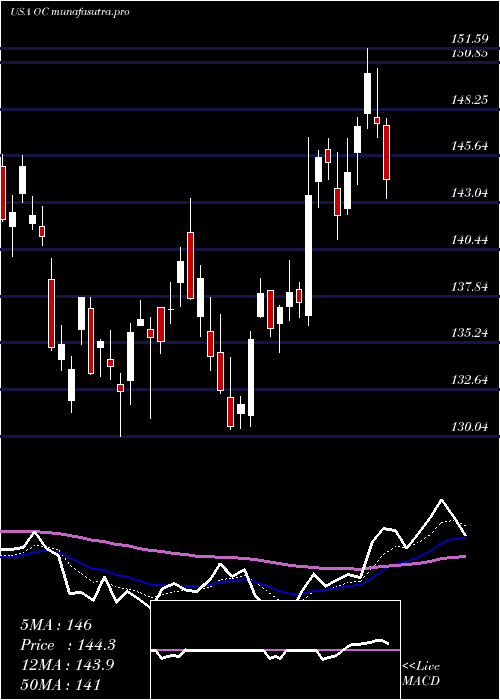
Monthly price and charts OwensCorning Strong monthly Stock price targets for OwensCorning OC are 111.53 and 116.48 | Monthly Target 1 | 108.07 | | Monthly Target 2 | 110.03 | | Monthly Target 3 | 113.01666666667 | | Monthly Target 4 | 114.98 | | Monthly Target 5 | 117.97 |
Monthly price and volumes Owens Corning
| Date |
Closing |
Open |
Range |
Volume |
Thu 04 December 2025 |
112.00 (-1.1%) |
111.66 |
111.05 - 116.00 |
0.2926 times |
Fri 28 November 2025 |
113.24 (-11.05%) |
123.00 |
97.53 - 123.07 |
1.9588 times |
Fri 31 October 2025 |
127.31 (-10%) |
140.77 |
123.02 - 143.47 |
1.1167 times |
Tue 30 September 2025 |
141.46 (-5.8%) |
147.01 |
138.83 - 159.42 |
1.0324 times |
Fri 29 August 2025 |
150.17 (7.7%) |
137.28 |
135.08 - 157.86 |
0.9496 times |
Thu 31 July 2025 |
139.43 (1.39%) |
136.75 |
136.23 - 151.59 |
0.7856 times |
Mon 30 June 2025 |
137.52 (2.67%) |
132.95 |
130.04 - 143.27 |
0.8575 times |
Fri 30 May 2025 |
133.95 (-7.88%) |
144.71 |
129.81 - 149.51 |
0.971 times |
Wed 30 April 2025 |
145.41 (1.81%) |
142.76 |
123.41 - 147.45 |
0.8853 times |
Mon 31 March 2025 |
142.82 (-7.28%) |
155.37 |
137.50 - 155.91 |
1.1505 times |
Fri 28 February 2025 |
154.04 (-16.53%) |
180.28 |
151.20 - 186.18 |
0.899 times |
DMA SMA EMA moving averages of Owens Corning OC
DMA (daily moving average) of Owens Corning OC
| DMA period | DMA value | | 5 day DMA | 113.11 | | 12 day DMA | 107.68 | | 20 day DMA | 105.72 | | 35 day DMA | 114.33 | | 50 day DMA | 121.41 | | 100 day DMA | 134.58 | | 150 day DMA | 136.12 | | 200 day DMA | 138.76 | EMA (exponential moving average) of Owens Corning OC
| EMA period | EMA current | EMA prev | EMA prev2 | | 5 day EMA | 112.14 | 112.21 | 111.25 | | 12 day EMA | 110.07 | 109.72 | 108.92 | | 20 day EMA | 110.8 | 110.67 | 110.31 | | 35 day EMA | 115.69 | 115.91 | 116.02 | | 50 day EMA | 122.79 | 123.23 | 123.6 |
SMA (simple moving average) of Owens Corning OC
| SMA period | SMA current | SMA prev | SMA prev2 | | 5 day SMA | 113.11 | 113.02 | 112.06 | | 12 day SMA | 107.68 | 106.61 | 105.58 | | 20 day SMA | 105.72 | 105.67 | 106.1 | | 35 day SMA | 114.33 | 114.77 | 115.17 | | 50 day SMA | 121.41 | 122.08 | 122.75 | | 100 day SMA | 134.58 | 134.96 | 135.29 | | 150 day SMA | 136.12 | 136.33 | 136.53 | | 200 day SMA | 138.76 | 139.08 | 139.4 |
|
|
