NewYork NYT full analysis,charts,indicators,moving averages,SMA,DMA,EMA,ADX,MACD,RSINew York NYT WideScreen charts, DMA,SMA,EMA technical analysis, forecast prediction, by indicators ADX,MACD,RSI,CCI USA stock exchange
operates under Consumer Services sector & deals in Newspapers Magazines
Daily price and charts and targets NewYork Strong Daily Stock price targets for NewYork NYT are 64.39 and 65.73 | Daily Target 1 | 63.37 | | Daily Target 2 | 64.06 | | Daily Target 3 | 64.71 | | Daily Target 4 | 65.4 | | Daily Target 5 | 66.05 |
Daily price and volume New York
| Date |
Closing |
Open |
Range |
Volume |
Fri 05 December 2025 |
64.75 (1.11%) |
64.02 |
64.02 - 65.36 |
1.03 times |
Thu 04 December 2025 |
64.04 (-0.25%) |
64.19 |
63.95 - 64.73 |
0.9092 times |
Wed 03 December 2025 |
64.20 (0.14%) |
64.07 |
64.07 - 64.61 |
0.734 times |
Tue 02 December 2025 |
64.11 (-1.03%) |
64.64 |
63.83 - 64.87 |
1.6132 times |
Mon 01 December 2025 |
64.78 (0.43%) |
64.20 |
64.20 - 65.18 |
1.0674 times |
Fri 28 November 2025 |
64.50 (-0.86%) |
64.95 |
64.17 - 65.25 |
0.5128 times |
Wed 26 November 2025 |
65.06 (0.67%) |
64.70 |
64.39 - 65.33 |
1.1738 times |
Tue 25 November 2025 |
64.63 (1.22%) |
64.35 |
64.04 - 64.89 |
0.8275 times |
Mon 24 November 2025 |
63.85 (-0.39%) |
63.60 |
63.58 - 64.42 |
1.2268 times |
Fri 21 November 2025 |
64.10 (0.9%) |
63.86 |
63.79 - 65.14 |
0.9055 times |
Thu 20 November 2025 |
63.53 (-0.35%) |
63.89 |
63.52 - 64.49 |
1.1822 times |
Weekly price and charts NewYork Strong weekly Stock price targets for NewYork NYT are 64.29 and 65.82 | Weekly Target 1 | 63.12 | | Weekly Target 2 | 63.93 | | Weekly Target 3 | 64.646666666667 | | Weekly Target 4 | 65.46 | | Weekly Target 5 | 66.18 |
Weekly price and volumes for New York
| Date |
Closing |
Open |
Range |
Volume |
Fri 05 December 2025 |
64.75 (0.39%) |
64.20 |
63.83 - 65.36 |
1.2416 times |
Fri 28 November 2025 |
64.50 (0.62%) |
63.60 |
63.58 - 65.33 |
0.8676 times |
Fri 21 November 2025 |
64.10 (0.25%) |
64.08 |
62.79 - 65.14 |
1.2197 times |
Fri 14 November 2025 |
63.94 (4.22%) |
61.25 |
61.25 - 64.75 |
1.4683 times |
Fri 07 November 2025 |
61.35 (7.65%) |
57.76 |
57.20 - 61.50 |
1.9272 times |
Fri 31 October 2025 |
56.99 (0%) |
56.68 |
56.68 - 57.34 |
0.2395 times |
Fri 31 October 2025 |
56.99 (-0.04%) |
57.00 |
55.93 - 57.62 |
0.9126 times |
Fri 24 October 2025 |
57.01 (1.46%) |
56.38 |
55.69 - 57.83 |
0.8861 times |
Fri 17 October 2025 |
56.19 (2.09%) |
54.74 |
54.10 - 56.50 |
0.9541 times |
Tue 07 October 2025 |
55.04 (-1.06%) |
55.92 |
54.51 - 55.99 |
0.2833 times |
Fri 03 October 2025 |
55.63 (-4.4%) |
58.43 |
54.92 - 58.43 |
0.9799 times |

Monthly price and charts NewYork Strong monthly Stock price targets for NewYork NYT are 64.29 and 65.82 | Monthly Target 1 | 63.12 | | Monthly Target 2 | 63.93 | | Monthly Target 3 | 64.646666666667 | | Monthly Target 4 | 65.46 | | Monthly Target 5 | 66.18 |
Monthly price and volumes New York
| Date |
Closing |
Open |
Range |
Volume |
Fri 05 December 2025 |
64.75 (0.39%) |
64.20 |
63.83 - 65.36 |
0.2789 times |
Fri 28 November 2025 |
64.50 (13.18%) |
57.76 |
57.20 - 65.33 |
1.2314 times |
Fri 31 October 2025 |
56.99 (-0.71%) |
57.21 |
54.10 - 57.83 |
0.8442 times |
Tue 30 September 2025 |
57.40 (-4.08%) |
59.38 |
56.80 - 59.55 |
1.0128 times |
Fri 29 August 2025 |
59.84 (15.32%) |
51.88 |
51.56 - 62.24 |
1.3836 times |
Thu 31 July 2025 |
51.89 (-7.31%) |
56.16 |
51.03 - 57.34 |
1.1818 times |
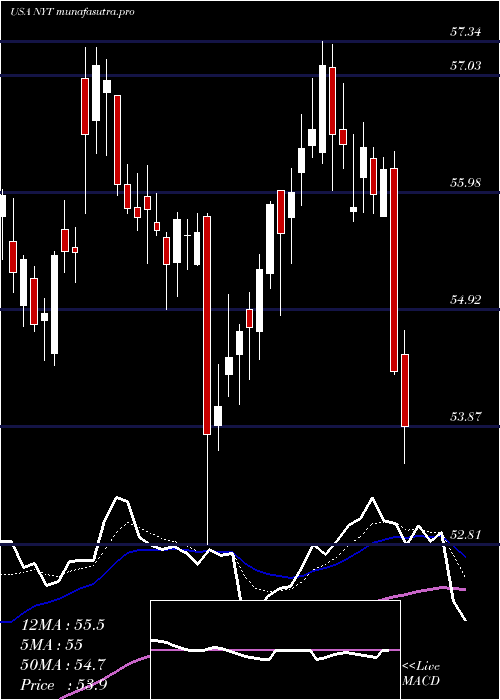
Mon 30 June 2025 |
55.98 (-2%) |
56.88 |
52.81 - 57.18 |
0.8284 times |
Fri 30 May 2025 |
57.12 (9.72%) |
52.03 |
51.31 - 57.28 |
1.1254 times |
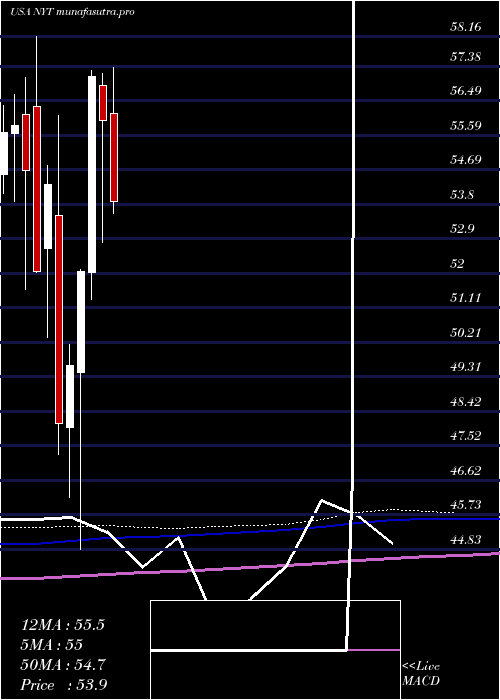
Wed 30 April 2025 |
52.06 (4.96%) |
49.43 |
44.83 - 52.09 |
0.9703 times |
Mon 31 March 2025 |
49.60 (3.14%) |
48.00 |
46.18 - 50.15 |
1.1431 times |
Fri 28 February 2025 |
48.09 (-11.44%) |
53.51 |
47.29 - 56.11 |
1.3082 times |
DMA SMA EMA moving averages of New York NYT
DMA (daily moving average) of New York NYT
| DMA period | DMA value | | 5 day DMA | 64.38 | | 12 day DMA | 64.28 | | 20 day DMA | 63.85 | | 35 day DMA | 60.96 | | 50 day DMA | 59.55 | | 100 day DMA | 58.37 | | 150 day DMA | 57.26 | | 200 day DMA | 55.09 | EMA (exponential moving average) of New York NYT
| EMA period | EMA current | EMA prev | EMA prev2 | | 5 day EMA | 64.4 | 64.23 | 64.33 | | 12 day EMA | 64.03 | 63.9 | 63.87 | | 20 day EMA | 63.22 | 63.06 | 62.96 | | 35 day EMA | 61.78 | 61.6 | 61.46 | | 50 day EMA | 59.93 | 59.73 | 59.55 |
SMA (simple moving average) of New York NYT
| SMA period | SMA current | SMA prev | SMA prev2 | | 5 day SMA | 64.38 | 64.33 | 64.53 | | 12 day SMA | 64.28 | 64.21 | 64.12 | | 20 day SMA | 63.85 | 63.61 | 63.29 | | 35 day SMA | 60.96 | 60.7 | 60.44 | | 50 day SMA | 59.55 | 59.41 | 59.3 | | 100 day SMA | 58.37 | 58.28 | 58.21 | | 150 day SMA | 57.26 | 57.17 | 57.08 | | 200 day SMA | 55.09 | 55.02 | 54.95 |
|
|
