NewYork NYMT full analysis,charts,indicators,moving averages,SMA,DMA,EMA,ADX,MACD,RSINew York NYMT WideScreen charts, DMA,SMA,EMA technical analysis, forecast prediction, by indicators ADX,MACD,RSI,CCI USA stock exchange
operates under Consumer Services sector & deals in Real Estate Investment Trusts
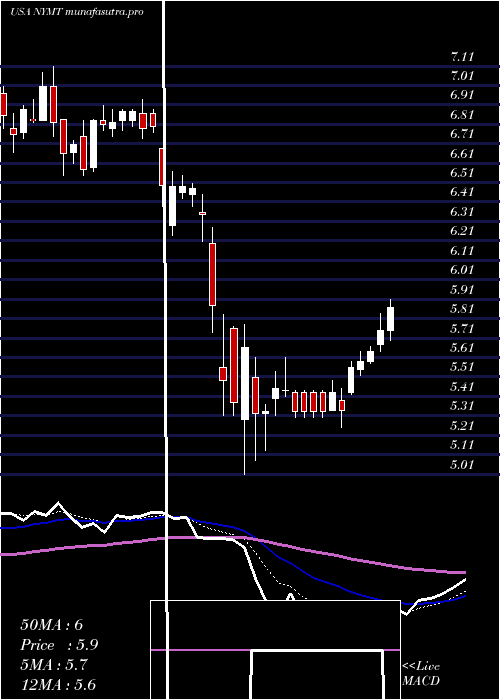
Daily price and charts and targets NewYork Strong Daily Stock price targets for NewYork NYMT are 7.02 and 7.2 | Daily Target 1 | 6.91 | | Daily Target 2 | 7.01 | | Daily Target 3 | 7.09 | | Daily Target 4 | 7.19 | | Daily Target 5 | 7.27 |
Daily price and volume New York
| Date |
Closing |
Open |
Range |
Volume |
Tue 02 September 2025 |
7.11 (-1.52%) |
7.11 |
6.99 - 7.17 |
1.5258 times |
Fri 29 August 2025 |
7.22 (0%) |
7.08 |
7.07 - 7.23 |
0.757 times |
Fri 29 August 2025 |
7.22 (2.27%) |
7.08 |
7.07 - 7.23 |
0.757 times |
Thu 28 August 2025 |
7.06 (-0.56%) |
7.12 |
7.05 - 7.12 |
0.6557 times |
Wed 27 August 2025 |
7.10 (-0.84%) |
7.13 |
7.05 - 7.20 |
0.8385 times |
Tue 26 August 2025 |
7.16 (0.85%) |
7.08 |
7.08 - 7.16 |
0.6173 times |
Mon 25 August 2025 |
7.10 (-0.56%) |
7.12 |
7.01 - 7.14 |
0.9727 times |
Fri 22 August 2025 |
7.14 (3.48%) |
6.96 |
6.92 - 7.21 |
1.5031 times |
Thu 21 August 2025 |
6.90 (-1.99%) |
6.99 |
6.90 - 7.05 |
1.0511 times |
Wed 20 August 2025 |
7.04 (1.73%) |
6.93 |
6.92 - 7.11 |
1.3217 times |
Tue 19 August 2025 |
6.92 (1.47%) |
6.84 |
6.83 - 7.00 |
0.8329 times |
Weekly price and charts NewYork Strong weekly Stock price targets for NewYork NYMT are 7.02 and 7.2 | Weekly Target 1 | 6.91 | | Weekly Target 2 | 7.01 | | Weekly Target 3 | 7.09 | | Weekly Target 4 | 7.19 | | Weekly Target 5 | 7.27 |
Weekly price and volumes for New York
| Date |
Closing |
Open |
Range |
Volume |
Tue 02 September 2025 |
7.11 (-1.52%) |
7.11 |
6.99 - 7.17 |
0.3412 times |
Fri 29 August 2025 |
7.22 (0%) |
7.08 |
7.07 - 7.23 |
0.1693 times |
Fri 29 August 2025 |
7.22 (1.12%) |
7.12 |
7.01 - 7.23 |
0.859 times |
Fri 22 August 2025 |
7.14 (4.39%) |
6.86 |
6.79 - 7.21 |
1.1721 times |
Fri 15 August 2025 |
6.84 (3.01%) |
6.67 |
6.57 - 6.95 |
1.1418 times |
Fri 08 August 2025 |
6.64 (0.91%) |
6.72 |
6.48 - 6.76 |
0.929 times |
Fri 01 August 2025 |
6.58 (-6.13%) |
7.05 |
6.16 - 7.07 |
2.1853 times |
Fri 25 July 2025 |
7.01 (4.78%) |
6.73 |
6.70 - 7.05 |
1.2638 times |
Fri 18 July 2025 |
6.69 (0.6%) |
6.65 |
6.60 - 6.83 |
1.1322 times |
Fri 11 July 2025 |
6.65 (-2.49%) |
6.81 |
6.61 - 6.81 |
0.8064 times |
Thu 03 July 2025 |
6.82 (2.56%) |
6.65 |
6.58 - 6.89 |
0.7317 times |
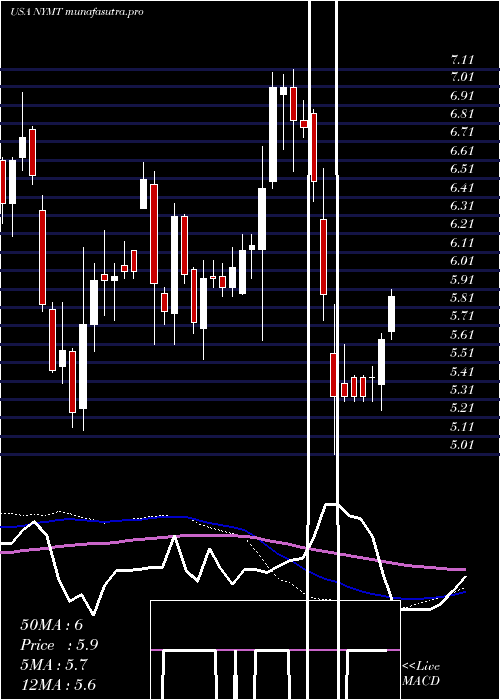
Monthly price and charts NewYork Strong monthly Stock price targets for NewYork NYMT are 7.02 and 7.2 | Monthly Target 1 | 6.91 | | Monthly Target 2 | 7.01 | | Monthly Target 3 | 7.09 | | Monthly Target 4 | 7.19 | | Monthly Target 5 | 7.27 |
Monthly price and volumes New York
| Date |
Closing |
Open |
Range |
Volume |
Tue 02 September 2025 |
7.11 (-1.52%) |
7.11 |
6.99 - 7.17 |
0.0672 times |
Fri 29 August 2025 |
7.22 (14.06%) |
6.32 |
6.25 - 7.23 |
0.9683 times |
Thu 31 July 2025 |
6.33 (-5.52%) |
6.70 |
6.16 - 7.07 |
1.0328 times |
Mon 30 June 2025 |
6.70 (2.6%) |
6.52 |
6.34 - 7.09 |
1.0461 times |
Fri 30 May 2025 |
6.53 (11.24%) |
6.49 |
6.09 - 7.27 |
1.295 times |
Wed 30 April 2025 |
5.87 (-9.55%) |
6.46 |
5.01 - 6.55 |
1.261 times |
Mon 31 March 2025 |
6.49 (-7.42%) |
6.97 |
6.24 - 7.11 |
1.1083 times |
Fri 28 February 2025 |
7.01 (16.25%) |
5.89 |
5.63 - 7.09 |
1.0779 times |
Fri 31 January 2025 |
6.03 (-0.5%) |
6.12 |
5.53 - 6.38 |
0.9627 times |
Tue 31 December 2024 |
6.06 (0.83%) |
6.35 |
5.61 - 6.60 |
1.1809 times |
Tue 26 November 2024 |
6.01 (4.16%) |
5.83 |
5.57 - 6.23 |
1.2103 times |

DMA SMA EMA moving averages of New York NYMT
DMA (daily moving average) of New York NYMT
| DMA period | DMA value | | 5 day DMA | 7.14 | | 12 day DMA | 7.07 | | 20 day DMA | 6.93 | | 35 day DMA | 6.86 | | 50 day DMA | 6.8 | | 100 day DMA | 6.56 | | 150 day DMA | 6.51 | | 200 day DMA | 6.38 | EMA (exponential moving average) of New York NYMT
| EMA period | EMA current | EMA prev | EMA prev2 | | 5 day EMA | 7.14 | 7.15 | 7.12 | | 12 day EMA | 7.07 | 7.06 | 7.03 | | 20 day EMA | 6.99 | 6.98 | 6.95 | | 35 day EMA | 6.91 | 6.9 | 6.88 | | 50 day EMA | 6.83 | 6.82 | 6.8 |
SMA (simple moving average) of New York NYMT
| SMA period | SMA current | SMA prev | SMA prev2 | | 5 day SMA | 7.14 | 7.15 | 7.13 | | 12 day SMA | 7.07 | 7.04 | 7.01 | | 20 day SMA | 6.93 | 6.91 | 6.88 | | 35 day SMA | 6.86 | 6.85 | 6.83 | | 50 day SMA | 6.8 | 6.79 | 6.78 | | 100 day SMA | 6.56 | 6.54 | 6.53 | | 150 day SMA | 6.51 | 6.5 | 6.49 | | 200 day SMA | 6.38 | 6.37 | 6.37 |
|
|
