NexpointResidential NXRT full analysis,charts,indicators,moving averages,SMA,DMA,EMA,ADX,MACD,RSINexpoint Residential NXRT WideScreen charts, DMA,SMA,EMA technical analysis, forecast prediction, by indicators ADX,MACD,RSI,CCI USA stock exchange
operates under Consumer Services sector & deals in Real Estate Investment Trusts
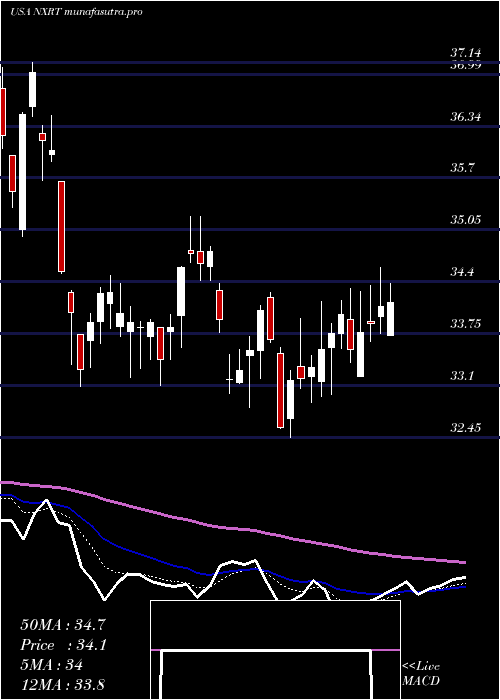
Daily price and charts and targets NexpointResidential Strong Daily Stock price targets for NexpointResidential NXRT are 30 and 30.71 | Daily Target 1 | 29.84 | | Daily Target 2 | 30.15 | | Daily Target 3 | 30.546666666667 | | Daily Target 4 | 30.86 | | Daily Target 5 | 31.26 |
Daily price and volume Nexpoint Residential
| Date |
Closing |
Open |
Range |
Volume |
Mon 20 October 2025 |
30.47 (-0.42%) |
30.65 |
30.23 - 30.94 |
0.8958 times |
Fri 17 October 2025 |
30.60 (-0.94%) |
30.88 |
30.47 - 31.16 |
1.3084 times |
Thu 16 October 2025 |
30.89 (-1.94%) |
31.35 |
30.49 - 31.65 |
1.2812 times |
Wed 15 October 2025 |
31.50 (0%) |
31.58 |
31.35 - 32.02 |
0.7691 times |
Tue 14 October 2025 |
31.50 (1.35%) |
31.04 |
30.75 - 31.58 |
1.5008 times |
Mon 13 October 2025 |
31.08 (-2.14%) |
30.93 |
30.66 - 31.15 |
0.6966 times |
Tue 07 October 2025 |
31.76 (1.96%) |
31.17 |
31.00 - 32.07 |
1.2699 times |
Mon 06 October 2025 |
31.15 (-1.49%) |
31.57 |
30.97 - 31.69 |
0.8208 times |
Fri 03 October 2025 |
31.62 (-0.41%) |
31.81 |
31.58 - 32.22 |
1.0181 times |
Thu 02 October 2025 |
31.75 (-1.4%) |
32.20 |
31.60 - 32.20 |
0.4393 times |
Wed 01 October 2025 |
32.20 (-0.06%) |
32.24 |
31.83 - 32.36 |
0.6785 times |
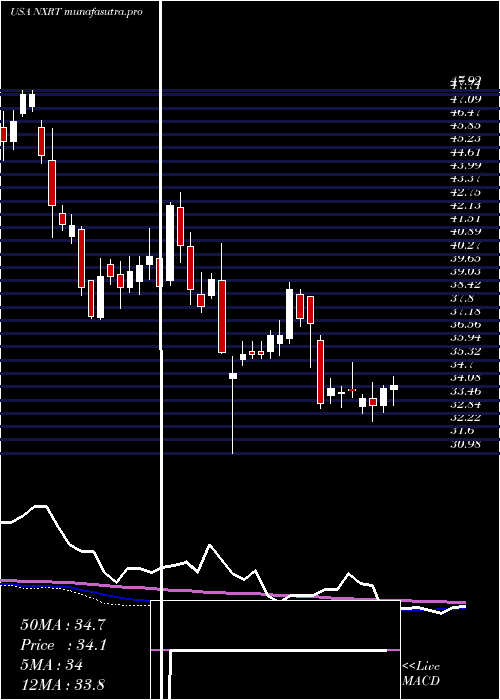
Weekly price and charts NexpointResidential Strong weekly Stock price targets for NexpointResidential NXRT are 30 and 30.71 | Weekly Target 1 | 29.84 | | Weekly Target 2 | 30.15 | | Weekly Target 3 | 30.546666666667 | | Weekly Target 4 | 30.86 | | Weekly Target 5 | 31.26 |
Weekly price and volumes for Nexpoint Residential
| Date |
Closing |
Open |
Range |
Volume |
Mon 20 October 2025 |
30.47 (-0.42%) |
30.65 |
30.23 - 30.94 |
0.2297 times |
Fri 17 October 2025 |
30.60 (-3.65%) |
30.93 |
30.47 - 32.02 |
1.4247 times |
Tue 07 October 2025 |
31.76 (0.44%) |
31.57 |
30.97 - 32.07 |
0.5361 times |
Fri 03 October 2025 |
31.62 (-1.22%) |
32.03 |
31.49 - 32.36 |
0.9865 times |
Fri 26 September 2025 |
32.01 (-2.23%) |
32.59 |
31.57 - 33.34 |
1.1415 times |
Fri 19 September 2025 |
32.74 (-3.22%) |
33.49 |
32.06 - 33.49 |
1.8389 times |
Fri 12 September 2025 |
33.83 (-2.42%) |
34.56 |
33.20 - 34.68 |
1.159 times |
Fri 05 September 2025 |
34.67 (0.46%) |
34.11 |
32.97 - 34.87 |
0.9485 times |
Fri 29 August 2025 |
34.51 (0%) |
33.97 |
33.97 - 34.70 |
0.3523 times |
Fri 29 August 2025 |
34.51 (2.92%) |
33.42 |
32.93 - 34.70 |
1.3827 times |
Fri 22 August 2025 |
33.53 (7.78%) |
31.06 |
30.82 - 33.63 |
1.6283 times |
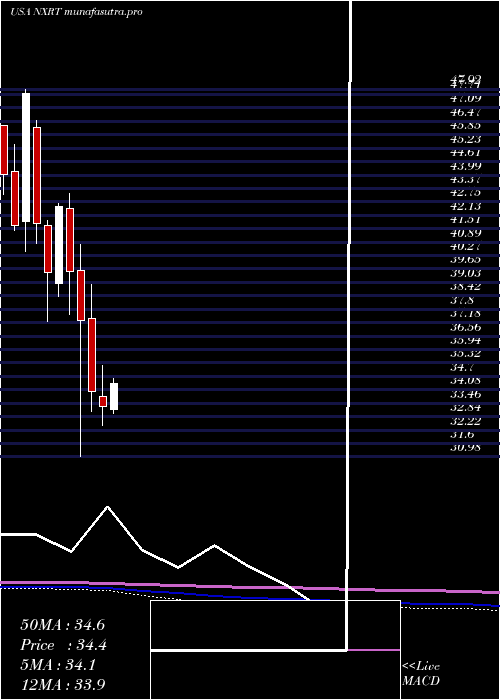
Monthly price and charts NexpointResidential Strong monthly Stock price targets for NexpointResidential NXRT are 29.29 and 31.42 | Monthly Target 1 | 28.89 | | Monthly Target 2 | 29.68 | | Monthly Target 3 | 31.02 | | Monthly Target 4 | 31.81 | | Monthly Target 5 | 33.15 |
Monthly price and volumes Nexpoint Residential
| Date |
Closing |
Open |
Range |
Volume |
Mon 20 October 2025 |
30.47 (-5.43%) |
32.24 |
30.23 - 32.36 |
0.6231 times |
Tue 30 September 2025 |
32.22 (-6.64%) |
34.11 |
31.49 - 34.87 |
1.2577 times |
Fri 29 August 2025 |
34.51 (10.68%) |
31.38 |
29.98 - 34.70 |
1.3028 times |
Thu 31 July 2025 |
31.18 (-6.42%) |
33.15 |
31.14 - 35.08 |
1.219 times |
Mon 30 June 2025 |
33.32 (-2%) |
33.78 |
32.45 - 35.22 |
1.1244 times |
Fri 30 May 2025 |
34.00 (-8.8%) |
37.37 |
33.09 - 38.93 |
0.906 times |
Wed 30 April 2025 |
37.28 (-5.69%) |
39.59 |
30.98 - 40.78 |
1.0575 times |
Mon 31 March 2025 |
39.53 (-7.1%) |
42.45 |
37.54 - 43.13 |
1.0474 times |
Fri 28 February 2025 |
42.55 (7.78%) |
38.98 |
38.39 - 42.68 |
0.7316 times |
Fri 31 January 2025 |
39.48 (-5.44%) |
41.66 |
37.24 - 41.87 |
0.7305 times |
Tue 31 December 2024 |
41.75 (-12.55%) |
46.20 |
40.83 - 46.49 |
0.7192 times |
DMA SMA EMA moving averages of Nexpoint Residential NXRT
DMA (daily moving average) of Nexpoint Residential NXRT
| DMA period | DMA value | | 5 day DMA | 30.99 | | 12 day DMA | 31.4 | | 20 day DMA | 31.76 | | 35 day DMA | 32.59 | | 50 day DMA | 32.41 | | 100 day DMA | 33.02 | | 150 day DMA | 34.36 | | 200 day DMA | 35.72 | EMA (exponential moving average) of Nexpoint Residential NXRT
| EMA period | EMA current | EMA prev | EMA prev2 | | 5 day EMA | 30.86 | 31.06 | 31.29 | | 12 day EMA | 31.31 | 31.46 | 31.62 | | 20 day EMA | 31.65 | 31.77 | 31.89 | | 35 day EMA | 31.9 | 31.98 | 32.06 | | 50 day EMA | 32.18 | 32.25 | 32.32 |
SMA (simple moving average) of Nexpoint Residential NXRT
| SMA period | SMA current | SMA prev | SMA prev2 | | 5 day SMA | 30.99 | 31.11 | 31.35 | | 12 day SMA | 31.4 | 31.49 | 31.61 | | 20 day SMA | 31.76 | 31.85 | 31.93 | | 35 day SMA | 32.59 | 32.68 | 32.75 | | 50 day SMA | 32.41 | 32.42 | 32.44 | | 100 day SMA | 33.02 | 33.06 | 33.12 | | 150 day SMA | 34.36 | 34.42 | 34.49 | | 200 day SMA | 35.72 | 35.78 | 35.84 |
|
|
