NuveenInsured NXN full analysis,charts,indicators,moving averages,SMA,DMA,EMA,ADX,MACD,RSINuveen Insured NXN WideScreen charts, DMA,SMA,EMA technical analysis, forecast prediction, by indicators ADX,MACD,RSI,CCI USA stock exchange
operates under N A sector & deals in N A
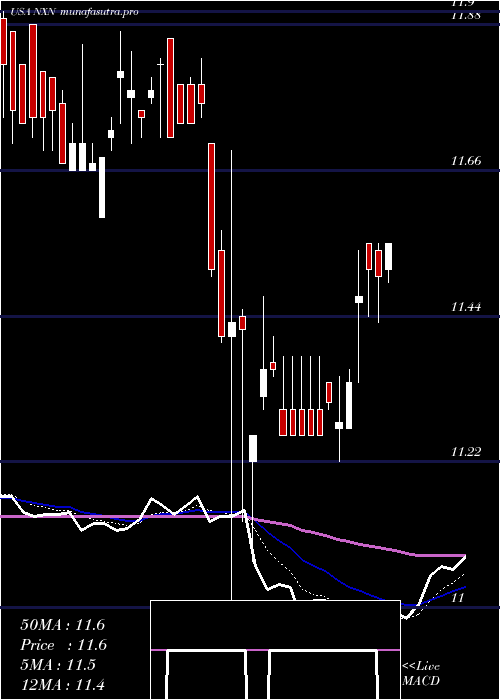
Daily price and charts and targets NuveenInsured Strong Daily Stock price targets for NuveenInsured NXN are 11.92 and 12 | Daily Target 1 | 11.86 | | Daily Target 2 | 11.9 | | Daily Target 3 | 11.936666666667 | | Daily Target 4 | 11.98 | | Daily Target 5 | 12.02 |
Daily price and volume Nuveen Insured
| Date |
Closing |
Open |
Range |
Volume |
Mon 20 October 2025 |
11.95 (-0.08%) |
11.89 |
11.89 - 11.97 |
0.9725 times |
Fri 17 October 2025 |
11.96 (-0.25%) |
11.90 |
11.90 - 11.97 |
3.4785 times |
Thu 16 October 2025 |
11.99 (-0.25%) |
12.03 |
11.96 - 12.03 |
0.4364 times |
Wed 15 October 2025 |
12.02 (-0.17%) |
12.05 |
11.97 - 12.05 |
0.5735 times |
Tue 14 October 2025 |
12.04 (0.25%) |
12.05 |
11.98 - 12.05 |
2.3315 times |
Mon 13 October 2025 |
12.01 (-0.25%) |
12.03 |
11.96 - 12.06 |
0.3865 times |
Tue 07 October 2025 |
12.04 (0.67%) |
11.92 |
11.92 - 12.04 |
0.4364 times |
Mon 06 October 2025 |
11.96 (-0.33%) |
11.96 |
11.91 - 12.02 |
0.7067 times |
Fri 03 October 2025 |
12.00 (0%) |
12.00 |
11.94 - 12.00 |
0.3616 times |
Thu 02 October 2025 |
12.00 (-0.08%) |
12.05 |
11.95 - 12.05 |
0.3164 times |
Wed 01 October 2025 |
12.01 (-0.08%) |
12.05 |
12.00 - 12.05 |
0.586 times |
Weekly price and charts NuveenInsured Strong weekly Stock price targets for NuveenInsured NXN are 11.92 and 12 | Weekly Target 1 | 11.86 | | Weekly Target 2 | 11.9 | | Weekly Target 3 | 11.936666666667 | | Weekly Target 4 | 11.98 | | Weekly Target 5 | 12.02 |
Weekly price and volumes for Nuveen Insured
| Date |
Closing |
Open |
Range |
Volume |
Mon 20 October 2025 |
11.95 (-0.08%) |
11.89 |
11.89 - 11.97 |
0.1591 times |
Fri 17 October 2025 |
11.96 (-0.66%) |
12.03 |
11.90 - 12.06 |
1.1789 times |
Tue 07 October 2025 |
12.04 (0.33%) |
11.96 |
11.91 - 12.04 |
0.187 times |
Fri 03 October 2025 |
12.00 (0.5%) |
12.01 |
11.94 - 12.05 |
0.5453 times |
Fri 26 September 2025 |
11.94 (-0.75%) |
11.96 |
11.89 - 12.12 |
2.8778 times |
Fri 19 September 2025 |
12.03 (0.67%) |
12.10 |
11.92 - 12.20 |
1.9784 times |
Fri 12 September 2025 |
11.95 (1.19%) |
11.81 |
11.73 - 12.02 |
1.3747 times |
Fri 05 September 2025 |
11.81 (0.43%) |
11.78 |
11.71 - 11.95 |
0.3467 times |
Fri 29 August 2025 |
11.76 (0%) |
11.71 |
11.68 - 11.78 |
0.3528 times |
Fri 29 August 2025 |
11.76 (0.51%) |
11.72 |
11.67 - 11.78 |
0.9994 times |
Fri 22 August 2025 |
11.70 (0.43%) |
11.62 |
11.51 - 11.74 |
0.516 times |
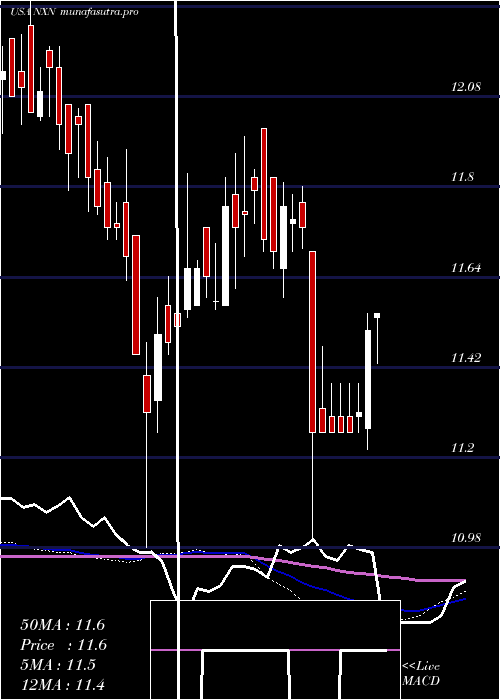
Monthly price and charts NuveenInsured Strong monthly Stock price targets for NuveenInsured NXN are 11.84 and 12.01 | Monthly Target 1 | 11.8 | | Monthly Target 2 | 11.87 | | Monthly Target 3 | 11.966666666667 | | Monthly Target 4 | 12.04 | | Monthly Target 5 | 12.14 |
Monthly price and volumes Nuveen Insured
| Date |
Closing |
Open |
Range |
Volume |
Mon 20 October 2025 |
11.95 (-0.58%) |
12.05 |
11.89 - 12.06 |
0.3739 times |
Tue 30 September 2025 |
12.02 (2.21%) |
11.78 |
11.71 - 12.20 |
1.4933 times |
Fri 29 August 2025 |
11.76 (2.44%) |
11.52 |
11.43 - 11.92 |
1.1357 times |
Thu 31 July 2025 |
11.48 (-1.29%) |
11.67 |
11.35 - 11.97 |
0.7745 times |
Mon 30 June 2025 |
11.63 (0.87%) |
11.59 |
11.24 - 11.68 |
1.0745 times |
Fri 30 May 2025 |
11.53 (-0.17%) |
11.62 |
11.38 - 12.12 |
0.9853 times |
Wed 30 April 2025 |
11.55 (-2.28%) |
11.86 |
11.00 - 11.86 |
1.1619 times |
Mon 31 March 2025 |
11.82 (-0.25%) |
12.00 |
11.59 - 12.00 |
0.8539 times |
Fri 28 February 2025 |
11.85 (2.33%) |
11.57 |
11.57 - 11.98 |
0.805 times |
Fri 31 January 2025 |
11.58 (2.03%) |
11.42 |
11.41 - 11.89 |
1.3421 times |
Tue 31 December 2024 |
11.35 (-3.49%) |
11.82 |
10.98 - 11.95 |
2.0162 times |

DMA SMA EMA moving averages of Nuveen Insured NXN
DMA (daily moving average) of Nuveen Insured NXN
| DMA period | DMA value | | 5 day DMA | 11.99 | | 12 day DMA | 12 | | 20 day DMA | 12 | | 35 day DMA | 11.94 | | 50 day DMA | 11.87 | | 100 day DMA | 11.68 | | 150 day DMA | 11.64 | | 200 day DMA | 11.65 | EMA (exponential moving average) of Nuveen Insured NXN
| EMA period | EMA current | EMA prev | EMA prev2 | | 5 day EMA | 11.98 | 11.99 | 12.01 | | 12 day EMA | 11.99 | 12 | 12.01 | | 20 day EMA | 11.98 | 11.98 | 11.98 | | 35 day EMA | 11.92 | 11.92 | 11.92 | | 50 day EMA | 11.85 | 11.85 | 11.85 |
SMA (simple moving average) of Nuveen Insured NXN
| SMA period | SMA current | SMA prev | SMA prev2 | | 5 day SMA | 11.99 | 12 | 12.02 | | 12 day SMA | 12 | 12.01 | 12 | | 20 day SMA | 12 | 12.01 | 12.01 | | 35 day SMA | 11.94 | 11.93 | 11.93 | | 50 day SMA | 11.87 | 11.86 | 11.85 | | 100 day SMA | 11.68 | 11.67 | 11.67 | | 150 day SMA | 11.64 | 11.63 | 11.63 | | 200 day SMA | 11.65 | 11.64 | 11.64 |
|
|
