NuveenInsured NXC full analysis,charts,indicators,moving averages,SMA,DMA,EMA,ADX,MACD,RSINuveen Insured NXC WideScreen charts, DMA,SMA,EMA technical analysis, forecast prediction, by indicators ADX,MACD,RSI,CCI USA stock exchange
operates under N A sector & deals in N A
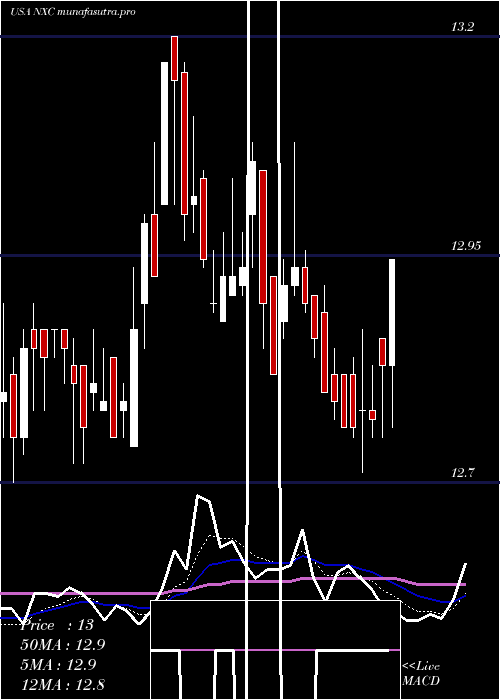
Daily price and charts and targets NuveenInsured Strong Daily Stock price targets for NuveenInsured NXC are 13 and 13.06 | Daily Target 1 | 12.95 | | Daily Target 2 | 12.98 | | Daily Target 3 | 13.01 | | Daily Target 4 | 13.04 | | Daily Target 5 | 13.07 |
Daily price and volume Nuveen Insured
| Date |
Closing |
Open |
Range |
Volume |
Mon 20 October 2025 |
13.01 (0%) |
13.00 |
12.98 - 13.04 |
1.9027 times |
Fri 17 October 2025 |
13.01 (-0.46%) |
12.98 |
12.98 - 13.05 |
0.5741 times |
Thu 16 October 2025 |
13.07 (-0.23%) |
13.09 |
13.07 - 13.14 |
0.1531 times |
Wed 15 October 2025 |
13.10 (0.46%) |
13.01 |
13.01 - 13.14 |
0.6725 times |
Tue 14 October 2025 |
13.04 (0.08%) |
13.08 |
13.04 - 13.15 |
1.3669 times |
Mon 13 October 2025 |
13.03 (-0.15%) |
13.02 |
13.01 - 13.09 |
0.667 times |
Fri 10 October 2025 |
13.05 (-0.23%) |
13.08 |
13.01 - 13.10 |
0.678 times |
Thu 09 October 2025 |
13.08 (0.15%) |
13.07 |
13.02 - 13.08 |
0.2296 times |
Wed 08 October 2025 |
13.06 (0.23%) |
13.05 |
12.96 - 13.06 |
3.1055 times |
Tue 07 October 2025 |
13.03 (0.15%) |
12.98 |
12.98 - 13.06 |
0.6506 times |
Mon 06 October 2025 |
13.01 (0.39%) |
12.95 |
12.93 - 13.15 |
3.0461 times |
Weekly price and charts NuveenInsured Strong weekly Stock price targets for NuveenInsured NXC are 13 and 13.06 | Weekly Target 1 | 12.95 | | Weekly Target 2 | 12.98 | | Weekly Target 3 | 13.01 | | Weekly Target 4 | 13.04 | | Weekly Target 5 | 13.07 |
Weekly price and volumes for Nuveen Insured
| Date |
Closing |
Open |
Range |
Volume |
Mon 20 October 2025 |
13.01 (0%) |
13.00 |
12.98 - 13.04 |
0.4253 times |
Fri 17 October 2025 |
13.01 (-0.31%) |
13.02 |
12.98 - 13.15 |
0.7674 times |
Fri 10 October 2025 |
13.05 (0.69%) |
12.95 |
12.93 - 13.15 |
1.7232 times |
Fri 03 October 2025 |
12.96 (0.15%) |
12.94 |
12.94 - 13.04 |
0.8592 times |
Fri 26 September 2025 |
12.94 (0.08%) |
12.93 |
12.87 - 13.04 |
1.8257 times |
Fri 19 September 2025 |
12.93 (-0.15%) |
12.93 |
12.92 - 13.05 |
1.002 times |
Fri 12 September 2025 |
12.95 (0.39%) |
12.93 |
12.87 - 13.05 |
1.4029 times |
Fri 05 September 2025 |
12.90 (0.39%) |
12.83 |
12.75 - 12.90 |
0.8578 times |
Fri 29 August 2025 |
12.85 (0%) |
12.78 |
12.76 - 12.87 |
0.1882 times |
Fri 29 August 2025 |
12.85 (0.47%) |
12.77 |
12.71 - 12.87 |
0.9483 times |
Fri 22 August 2025 |
12.79 (-0.23%) |
12.81 |
12.71 - 12.88 |
0.7992 times |

Monthly price and charts NuveenInsured Strong monthly Stock price targets for NuveenInsured NXC are 12.9 and 13.12 | Monthly Target 1 | 12.81 | | Monthly Target 2 | 12.91 | | Monthly Target 3 | 13.03 | | Monthly Target 4 | 13.13 | | Monthly Target 5 | 13.25 |
Monthly price and volumes Nuveen Insured
| Date |
Closing |
Open |
Range |
Volume |
Mon 20 October 2025 |
13.01 (0.23%) |
13.01 |
12.93 - 13.15 |
0.7214 times |
Tue 30 September 2025 |
12.98 (1.01%) |
12.83 |
12.75 - 13.05 |
1.1248 times |
Fri 29 August 2025 |
12.85 (0.16%) |
12.83 |
12.71 - 12.95 |
0.7715 times |
Thu 31 July 2025 |
12.83 (-2.58%) |
13.20 |
12.71 - 13.20 |
0.992 times |
Mon 30 June 2025 |
13.17 (3.86%) |
12.71 |
12.68 - 13.17 |
0.8947 times |
Fri 30 May 2025 |
12.68 (-1.32%) |
12.92 |
12.66 - 13.16 |
1.1027 times |
Wed 30 April 2025 |
12.85 (-2.58%) |
13.25 |
12.41 - 13.38 |
1.6248 times |
Mon 31 March 2025 |
13.19 (0.3%) |
13.15 |
12.88 - 13.21 |
0.7558 times |
Fri 28 February 2025 |
13.15 (-0.15%) |
13.22 |
13.00 - 13.39 |
0.9657 times |
Fri 31 January 2025 |
13.17 (1.86%) |
13.00 |
12.90 - 13.24 |
1.0465 times |
Tue 31 December 2024 |
12.93 (-3.58%) |
13.33 |
12.90 - 13.34 |
1.5211 times |

DMA SMA EMA moving averages of Nuveen Insured NXC
DMA (daily moving average) of Nuveen Insured NXC
| DMA period | DMA value | | 5 day DMA | 13.05 | | 12 day DMA | 13.04 | | 20 day DMA | 13.01 | | 35 day DMA | 12.98 | | 50 day DMA | 12.93 | | 100 day DMA | 12.89 | | 150 day DMA | 12.89 | | 200 day DMA | 12.94 | EMA (exponential moving average) of Nuveen Insured NXC
| EMA period | EMA current | EMA prev | EMA prev2 | | 5 day EMA | 13.03 | 13.04 | 13.06 | | 12 day EMA | 13.04 | 13.04 | 13.04 | | 20 day EMA | 13.02 | 13.02 | 13.02 | | 35 day EMA | 12.99 | 12.99 | 12.99 | | 50 day EMA | 12.94 | 12.94 | 12.94 |
SMA (simple moving average) of Nuveen Insured NXC
| SMA period | SMA current | SMA prev | SMA prev2 | | 5 day SMA | 13.05 | 13.05 | 13.06 | | 12 day SMA | 13.04 | 13.04 | 13.04 | | 20 day SMA | 13.01 | 13.01 | 13 | | 35 day SMA | 12.98 | 12.97 | 12.97 | | 50 day SMA | 12.93 | 12.93 | 12.92 | | 100 day SMA | 12.89 | 12.89 | 12.89 | | 150 day SMA | 12.89 | 12.89 | 12.89 | | 200 day SMA | 12.94 | 12.94 | 12.94 |
|
|
