NorthwestNatural NWN full analysis,charts,indicators,moving averages,SMA,DMA,EMA,ADX,MACD,RSINorthwest Natural NWN WideScreen charts, DMA,SMA,EMA technical analysis, forecast prediction, by indicators ADX,MACD,RSI,CCI USA stock exchange
operates under Public Utilities sector & deals in Oil Gas Transmission
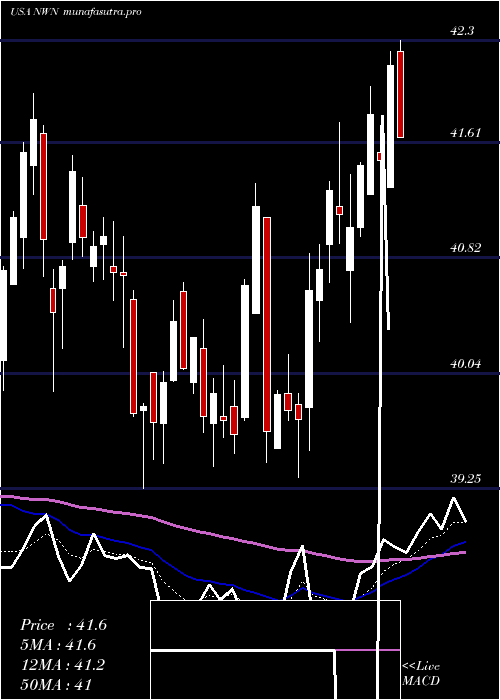
Daily price and charts and targets NorthwestNatural Strong Daily Stock price targets for NorthwestNatural NWN are 45.15 and 47.16 | Daily Target 1 | 44.8 | | Daily Target 2 | 45.5 | | Daily Target 3 | 46.806666666667 | | Daily Target 4 | 47.51 | | Daily Target 5 | 48.82 |
Daily price and volume Northwest Natural
| Date |
Closing |
Open |
Range |
Volume |
Thu 04 December 2025 |
46.21 (-3.45%) |
47.67 |
46.10 - 48.11 |
1.0504 times |
Wed 03 December 2025 |
47.86 (-0.87%) |
48.52 |
47.71 - 48.83 |
0.9128 times |
Tue 02 December 2025 |
48.28 (-1.31%) |
48.90 |
48.26 - 49.53 |
1.0485 times |
Mon 01 December 2025 |
48.92 (-1.11%) |
49.14 |
48.52 - 49.45 |
0.8524 times |
Fri 28 November 2025 |
49.47 (0.57%) |
49.23 |
49.01 - 49.49 |
0.5114 times |
Wed 26 November 2025 |
49.19 (0.7%) |
48.72 |
48.72 - 49.63 |
1.6373 times |
Tue 25 November 2025 |
48.85 (0.74%) |
48.70 |
48.55 - 49.13 |
1.0415 times |
Mon 24 November 2025 |
48.49 (0.83%) |
48.03 |
47.66 - 48.69 |
0.9106 times |
Fri 21 November 2025 |
48.09 (1.01%) |
47.70 |
47.45 - 48.60 |
1.0282 times |
Thu 20 November 2025 |
47.61 (1.06%) |
47.20 |
47.10 - 48.09 |
1.0069 times |
Wed 19 November 2025 |
47.11 (-0.95%) |
47.45 |
47.10 - 47.78 |
0.9427 times |
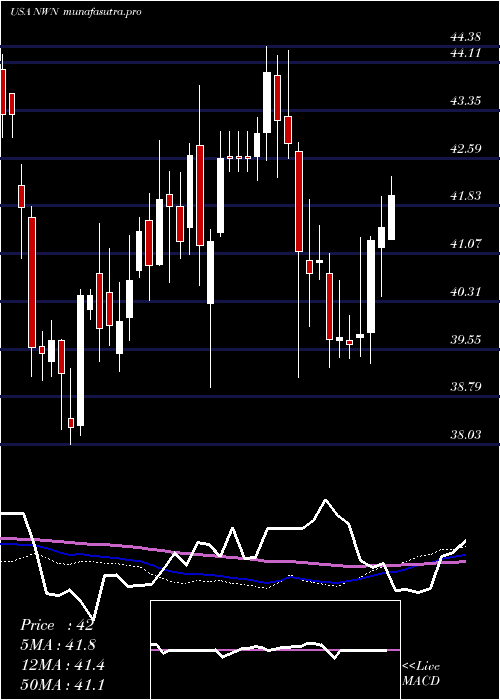
Weekly price and charts NorthwestNatural Strong weekly Stock price targets for NorthwestNatural NWN are 44.44 and 47.87 | Weekly Target 1 | 43.85 | | Weekly Target 2 | 45.03 | | Weekly Target 3 | 47.28 | | Weekly Target 4 | 48.46 | | Weekly Target 5 | 50.71 |
Weekly price and volumes for Northwest Natural
| Date |
Closing |
Open |
Range |
Volume |
Thu 04 December 2025 |
46.21 (-6.59%) |
49.14 |
46.10 - 49.53 |
1.0468 times |
Fri 28 November 2025 |
49.47 (2.87%) |
48.03 |
47.66 - 49.63 |
1.1109 times |
Fri 21 November 2025 |
48.09 (0.23%) |
48.23 |
47.10 - 48.60 |
1.2627 times |
Fri 14 November 2025 |
47.98 (2.52%) |
46.78 |
46.44 - 48.50 |
1.4115 times |
Fri 07 November 2025 |
46.80 (2.79%) |
46.41 |
45.33 - 47.11 |
0.9229 times |
Fri 31 October 2025 |
45.53 (0%) |
45.38 |
44.84 - 45.68 |
0.2544 times |
Fri 31 October 2025 |
45.53 (-4.69%) |
47.63 |
44.84 - 47.74 |
1.3056 times |
Fri 24 October 2025 |
47.77 (3.92%) |
46.11 |
46.03 - 47.79 |
1.3042 times |
Fri 17 October 2025 |
45.97 (4.31%) |
44.61 |
43.78 - 45.99 |
1.0403 times |
Tue 07 October 2025 |
44.07 (-0.72%) |
44.18 |
43.91 - 44.69 |
0.3408 times |
Fri 03 October 2025 |
44.39 (-0.58%) |
44.65 |
42.42 - 45.07 |
0.8973 times |
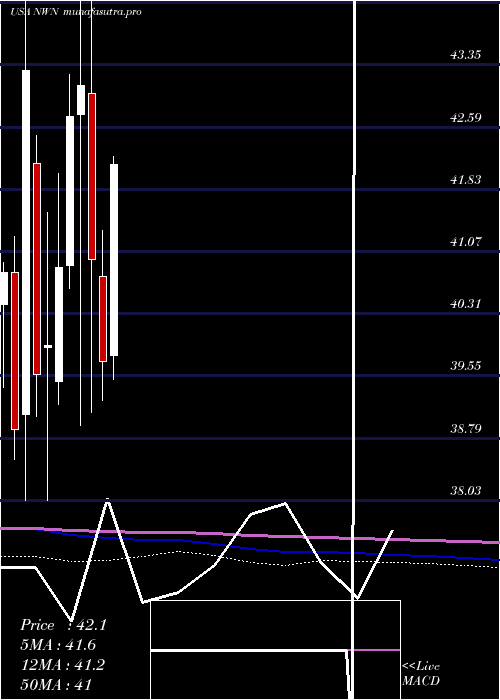
Monthly price and charts NorthwestNatural Strong monthly Stock price targets for NorthwestNatural NWN are 44.44 and 47.87 | Monthly Target 1 | 43.85 | | Monthly Target 2 | 45.03 | | Monthly Target 3 | 47.28 | | Monthly Target 4 | 48.46 | | Monthly Target 5 | 50.71 |
Monthly price and volumes Northwest Natural
| Date |
Closing |
Open |
Range |
Volume |
Thu 04 December 2025 |
46.21 (-6.59%) |
49.14 |
46.10 - 49.53 |
0.206 times |
Fri 28 November 2025 |
49.47 (8.65%) |
46.41 |
45.33 - 49.63 |
0.9267 times |
Fri 31 October 2025 |
45.53 (1.34%) |
44.82 |
42.42 - 47.79 |
0.9335 times |
Tue 30 September 2025 |
44.93 (8.19%) |
41.37 |
40.90 - 45.05 |
0.969 times |
Fri 29 August 2025 |
41.53 (4.03%) |
40.19 |
39.29 - 42.15 |
1.0718 times |
Thu 31 July 2025 |
39.92 (0.5%) |
39.80 |
39.51 - 43.13 |
1.1767 times |
Mon 30 June 2025 |
39.72 (-3.05%) |
40.76 |
39.25 - 41.33 |
1.2899 times |
Fri 30 May 2025 |
40.97 (-4.94%) |
43.00 |
39.10 - 44.31 |
1.1807 times |
Wed 30 April 2025 |
43.10 (0.89%) |
42.75 |
38.94 - 44.38 |
1.3108 times |
Mon 31 March 2025 |
42.72 (4.5%) |
40.90 |
40.62 - 43.24 |
0.9349 times |
Fri 28 February 2025 |
40.88 (2.4%) |
39.48 |
39.20 - 42.03 |
0.736 times |
DMA SMA EMA moving averages of Northwest Natural NWN
DMA (daily moving average) of Northwest Natural NWN
| DMA period | DMA value | | 5 day DMA | 48.15 | | 12 day DMA | 48.14 | | 20 day DMA | 47.88 | | 35 day DMA | 47.3 | | 50 day DMA | 46.36 | | 100 day DMA | 43.79 | | 150 day DMA | 42.9 | | 200 day DMA | 42.65 | EMA (exponential moving average) of Northwest Natural NWN
| EMA period | EMA current | EMA prev | EMA prev2 | | 5 day EMA | 47.68 | 48.41 | 48.69 | | 12 day EMA | 47.94 | 48.26 | 48.33 | | 20 day EMA | 47.71 | 47.87 | 47.87 | | 35 day EMA | 46.99 | 47.04 | 46.99 | | 50 day EMA | 46.19 | 46.19 | 46.12 |
SMA (simple moving average) of Northwest Natural NWN
| SMA period | SMA current | SMA prev | SMA prev2 | | 5 day SMA | 48.15 | 48.74 | 48.94 | | 12 day SMA | 48.14 | 48.24 | 48.25 | | 20 day SMA | 47.88 | 47.87 | 47.82 | | 35 day SMA | 47.3 | 47.27 | 47.17 | | 50 day SMA | 46.36 | 46.29 | 46.18 | | 100 day SMA | 43.79 | 43.74 | 43.68 | | 150 day SMA | 42.9 | 42.89 | 42.86 | | 200 day SMA | 42.65 | 42.63 | 42.59 |
|
|
