NorwoodFinancial NWFL full analysis,charts,indicators,moving averages,SMA,DMA,EMA,ADX,MACD,RSINorwood Financial NWFL WideScreen charts, DMA,SMA,EMA technical analysis, forecast prediction, by indicators ADX,MACD,RSI,CCI USA stock exchange
operates under Finance sector & deals in Major Banks
Daily price and charts and targets NorwoodFinancial Strong Daily Stock price targets for NorwoodFinancial NWFL are 28.52 and 29.03 | Daily Target 1 | 28.43 | | Daily Target 2 | 28.6 | | Daily Target 3 | 28.94 | | Daily Target 4 | 29.11 | | Daily Target 5 | 29.45 |
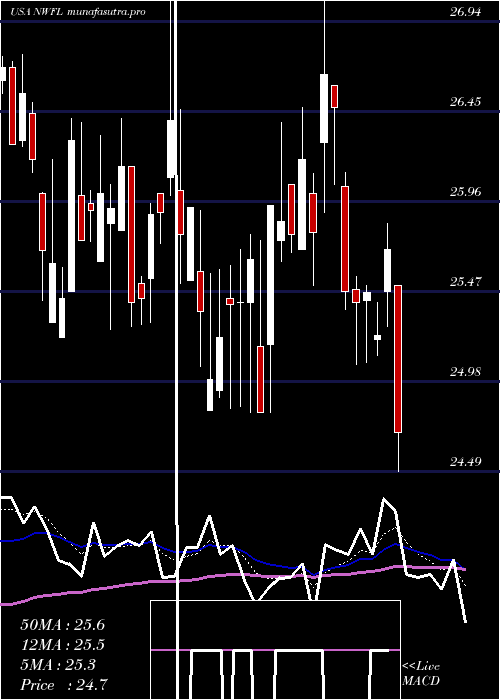
Daily price and volume Norwood Financial
| Date |
Closing |
Open |
Range |
Volume |
Thu 04 December 2025 |
28.77 (-0.79%) |
28.94 |
28.77 - 29.28 |
0.3369 times |
Wed 03 December 2025 |
29.00 (1.68%) |
28.51 |
28.51 - 29.00 |
0.374 times |
Tue 02 December 2025 |
28.52 (0.21%) |
28.49 |
28.49 - 28.92 |
0.4482 times |
Mon 01 December 2025 |
28.46 (-0.7%) |
28.37 |
28.24 - 29.01 |
1.1005 times |
Fri 28 November 2025 |
28.66 (0.74%) |
28.45 |
28.15 - 28.66 |
0.6121 times |
Wed 26 November 2025 |
28.45 (0.14%) |
28.25 |
28.21 - 28.51 |
3.2519 times |
Tue 25 November 2025 |
28.41 (2.08%) |
28.02 |
27.93 - 28.50 |
0.5131 times |
Mon 24 November 2025 |
27.83 (-0.68%) |
28.02 |
27.56 - 28.02 |
0.4359 times |
Fri 21 November 2025 |
28.02 (4.05%) |
26.92 |
26.92 - 28.10 |
2.1669 times |
Thu 20 November 2025 |
26.93 (-0.11%) |
27.10 |
26.85 - 27.41 |
0.7604 times |
Wed 19 November 2025 |
26.96 (0.45%) |
26.85 |
26.85 - 27.14 |
0.5935 times |
Weekly price and charts NorwoodFinancial Strong weekly Stock price targets for NorwoodFinancial NWFL are 28.51 and 29.55 | Weekly Target 1 | 27.72 | | Weekly Target 2 | 28.25 | | Weekly Target 3 | 28.763333333333 | | Weekly Target 4 | 29.29 | | Weekly Target 5 | 29.8 |
Weekly price and volumes for Norwood Financial
| Date |
Closing |
Open |
Range |
Volume |
Thu 04 December 2025 |
28.77 (0.38%) |
28.37 |
28.24 - 29.28 |
0.5885 times |
Fri 28 November 2025 |
28.66 (2.28%) |
28.02 |
27.56 - 28.66 |
1.2535 times |
Fri 21 November 2025 |
28.02 (1.71%) |
27.47 |
26.83 - 28.10 |
1.2624 times |
Fri 14 November 2025 |
27.55 (3.42%) |
26.64 |
26.50 - 27.63 |
1.0917 times |
Fri 07 November 2025 |
26.64 (0.11%) |
26.30 |
26.11 - 26.87 |
0.5402 times |
Fri 31 October 2025 |
26.61 (0%) |
26.56 |
26.25 - 26.99 |
0.1908 times |
Fri 31 October 2025 |
26.61 (-0.34%) |
26.98 |
25.50 - 27.00 |
1.809 times |
Fri 24 October 2025 |
26.70 (9.56%) |
24.63 |
24.38 - 26.77 |
1.0861 times |
Fri 17 October 2025 |
24.37 (-0.98%) |
25.60 |
23.82 - 25.60 |
0.6827 times |
Fri 10 October 2025 |
24.61 (-3.45%) |
25.49 |
24.61 - 26.15 |
1.495 times |
Fri 03 October 2025 |
25.49 (-1.96%) |
25.62 |
25.00 - 25.79 |
0.8001 times |
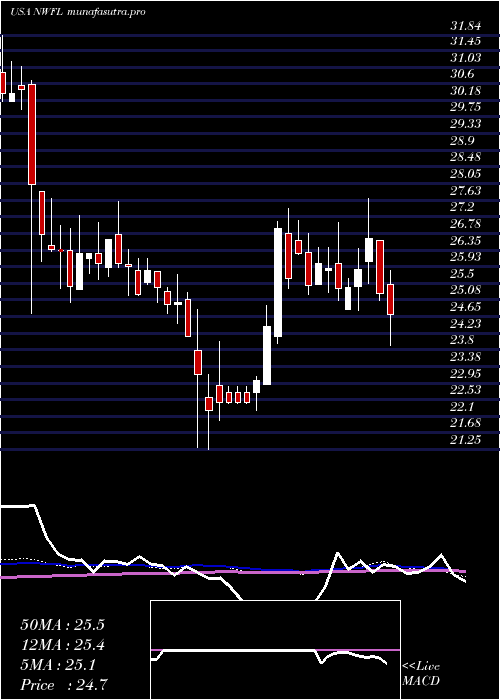
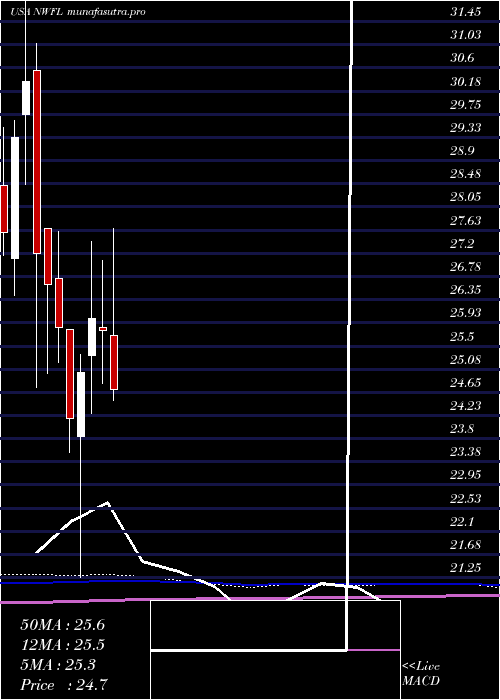
Monthly price and charts NorwoodFinancial Strong monthly Stock price targets for NorwoodFinancial NWFL are 28.51 and 29.55 | Monthly Target 1 | 27.72 | | Monthly Target 2 | 28.25 | | Monthly Target 3 | 28.763333333333 | | Monthly Target 4 | 29.29 | | Monthly Target 5 | 29.8 |
Monthly price and volumes Norwood Financial
| Date |
Closing |
Open |
Range |
Volume |
Thu 04 December 2025 |
28.77 (0.38%) |
28.37 |
28.24 - 29.28 |
0.1639 times |
Fri 28 November 2025 |
28.66 (7.7%) |
26.30 |
26.11 - 28.66 |
1.1551 times |
Fri 31 October 2025 |
26.61 (4.68%) |
25.26 |
23.82 - 27.00 |
1.6264 times |
Tue 30 September 2025 |
25.42 (-6.06%) |
27.04 |
25.27 - 27.23 |
0.6834 times |
Fri 29 August 2025 |
27.06 (11.63%) |
24.20 |
23.71 - 27.33 |
1.2856 times |
Thu 31 July 2025 |
24.24 (-5.97%) |
25.70 |
23.70 - 27.66 |
1.1769 times |
Mon 30 June 2025 |
25.78 (-0.85%) |
25.84 |
24.81 - 27.06 |
0.7184 times |
Fri 30 May 2025 |
26.00 (3.96%) |
25.32 |
24.27 - 27.42 |
0.8951 times |
Wed 30 April 2025 |
25.01 (3.48%) |
23.83 |
21.25 - 25.35 |
1.3843 times |
Mon 31 March 2025 |
24.17 (-6.46%) |
25.80 |
23.55 - 25.80 |
0.911 times |
Fri 28 February 2025 |
25.84 (-2.93%) |
26.74 |
25.19 - 27.60 |
0.5289 times |
DMA SMA EMA moving averages of Norwood Financial NWFL
DMA (daily moving average) of Norwood Financial NWFL
| DMA period | DMA value | | 5 day DMA | 28.68 | | 12 day DMA | 28.07 | | 20 day DMA | 27.65 | | 35 day DMA | 26.94 | | 50 day DMA | 26.47 | | 100 day DMA | 25.99 | | 150 day DMA | 25.94 | | 200 day DMA | 25.52 | EMA (exponential moving average) of Norwood Financial NWFL
| EMA period | EMA current | EMA prev | EMA prev2 | | 5 day EMA | 28.65 | 28.59 | 28.38 | | 12 day EMA | 28.2 | 28.1 | 27.94 | | 20 day EMA | 27.79 | 27.69 | 27.55 | | 35 day EMA | 27.22 | 27.13 | 27.02 | | 50 day EMA | 26.68 | 26.59 | 26.49 |
SMA (simple moving average) of Norwood Financial NWFL
| SMA period | SMA current | SMA prev | SMA prev2 | | 5 day SMA | 28.68 | 28.62 | 28.5 | | 12 day SMA | 28.07 | 27.95 | 27.83 | | 20 day SMA | 27.65 | 27.55 | 27.41 | | 35 day SMA | 26.94 | 26.83 | 26.73 | | 50 day SMA | 26.47 | 26.42 | 26.36 | | 100 day SMA | 25.99 | 25.95 | 25.92 | | 150 day SMA | 25.94 | 25.92 | 25.89 | | 200 day SMA | 25.52 | 25.5 | 25.49 |
|
|
