NorthwesternCorporation NWE full analysis,charts,indicators,moving averages,SMA,DMA,EMA,ADX,MACD,RSINorthwestern Corporation NWE WideScreen charts, DMA,SMA,EMA technical analysis, forecast prediction, by indicators ADX,MACD,RSI,CCI USA stock exchange
operates under Public Utilities sector & deals in Power Generation
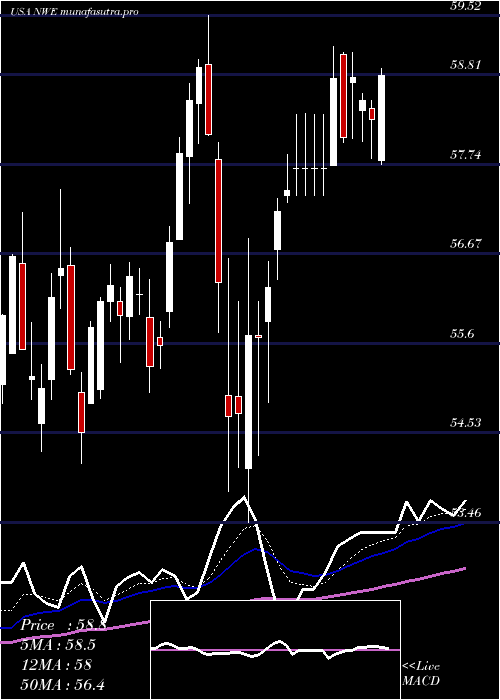
Daily price and charts and targets NorthwesternCorporation Strong Daily Stock price targets for NorthwesternCorporation NWE are 64.89 and 66.26 | Daily Target 1 | 64.63 | | Daily Target 2 | 65.15 | | Daily Target 3 | 66 | | Daily Target 4 | 66.52 | | Daily Target 5 | 67.37 |
Daily price and volume Northwestern Corporation
| Date |
Closing |
Open |
Range |
Volume |
Thu 04 December 2025 |
65.67 (-1.57%) |
66.31 |
65.48 - 66.85 |
0.7604 times |
Wed 03 December 2025 |
66.72 (-0.58%) |
67.74 |
66.03 - 67.82 |
1.4108 times |
Tue 02 December 2025 |
67.11 (-1.27%) |
67.97 |
66.89 - 68.06 |
0.9561 times |
Mon 01 December 2025 |
67.97 (-1.62%) |
68.82 |
67.62 - 68.82 |
0.7428 times |
Fri 28 November 2025 |
69.09 (1.17%) |
67.95 |
67.95 - 69.23 |
0.569 times |
Wed 26 November 2025 |
68.29 (1.16%) |
67.36 |
67.35 - 68.48 |
1.1363 times |
Tue 25 November 2025 |
67.51 (1.11%) |
67.20 |
66.03 - 67.80 |
1.1607 times |
Mon 24 November 2025 |
66.77 (1.64%) |
65.74 |
65.40 - 66.97 |
1.1555 times |
Fri 21 November 2025 |
65.69 (0.12%) |
65.61 |
65.41 - 66.32 |
0.9652 times |
Thu 20 November 2025 |
65.61 (0.41%) |
65.66 |
65.52 - 67.23 |
1.1432 times |
Wed 19 November 2025 |
65.34 (-0.73%) |
65.64 |
65.25 - 66.51 |
0.8024 times |
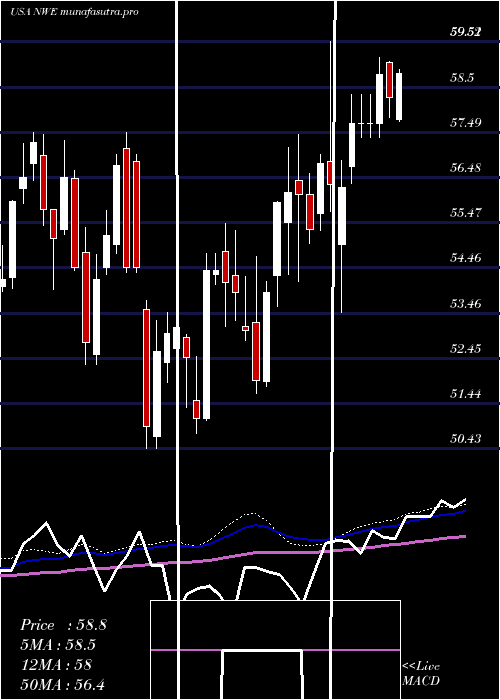
Weekly price and charts NorthwesternCorporation Strong weekly Stock price targets for NorthwesternCorporation NWE are 63.91 and 67.25 | Weekly Target 1 | 63.32 | | Weekly Target 2 | 64.49 | | Weekly Target 3 | 66.656666666667 | | Weekly Target 4 | 67.83 | | Weekly Target 5 | 70 |
Weekly price and volumes for Northwestern Corporation
| Date |
Closing |
Open |
Range |
Volume |
Thu 04 December 2025 |
65.67 (-4.95%) |
68.82 |
65.48 - 68.82 |
1.1977 times |
Fri 28 November 2025 |
69.09 (5.18%) |
65.74 |
65.40 - 69.23 |
1.2445 times |
Fri 21 November 2025 |
65.69 (0.89%) |
65.16 |
64.88 - 67.23 |
1.5094 times |
Fri 14 November 2025 |
65.11 (0.14%) |
64.60 |
64.06 - 67.46 |
1.499 times |
Fri 07 November 2025 |
65.02 (8.97%) |
60.23 |
59.85 - 65.69 |
1.252 times |
Fri 31 October 2025 |
59.67 (0%) |
59.52 |
58.89 - 60.10 |
0.2567 times |
Fri 31 October 2025 |
59.67 (-4.25%) |
62.00 |
58.89 - 62.29 |
0.8983 times |
Fri 24 October 2025 |
62.32 (5.15%) |
59.66 |
59.38 - 62.43 |
0.7274 times |
Fri 17 October 2025 |
59.27 (0.65%) |
57.68 |
57.12 - 59.64 |
1.0783 times |
Tue 07 October 2025 |
58.89 (2.01%) |
57.38 |
57.38 - 58.93 |
0.3368 times |
Fri 03 October 2025 |
57.73 (-0.5%) |
57.96 |
56.62 - 58.78 |
0.7405 times |
Monthly price and charts NorthwesternCorporation Strong monthly Stock price targets for NorthwesternCorporation NWE are 63.91 and 67.25 | Monthly Target 1 | 63.32 | | Monthly Target 2 | 64.49 | | Monthly Target 3 | 66.656666666667 | | Monthly Target 4 | 67.83 | | Monthly Target 5 | 70 |
Monthly price and volumes Northwestern Corporation
| Date |
Closing |
Open |
Range |
Volume |
Thu 04 December 2025 |
65.67 (-4.95%) |
68.82 |
65.48 - 68.82 |
0.2624 times |
Fri 28 November 2025 |
69.09 (15.79%) |
60.23 |
59.85 - 69.23 |
1.2063 times |
Fri 31 October 2025 |
59.67 (1.81%) |
58.54 |
56.62 - 62.43 |
0.8065 times |
Tue 30 September 2025 |
58.61 (1.91%) |
57.00 |
55.50 - 58.78 |
0.8587 times |
Fri 29 August 2025 |
57.51 (7.09%) |
53.96 |
53.19 - 59.50 |
1.2306 times |
Thu 31 July 2025 |
53.70 (4.68%) |
51.18 |
50.93 - 54.07 |
1.0904 times |
Mon 30 June 2025 |
51.30 (-7.28%) |
54.70 |
50.46 - 54.78 |
1.0509 times |
Fri 30 May 2025 |
55.33 (-4.98%) |
58.28 |
53.45 - 58.84 |
0.8568 times |
Wed 30 April 2025 |
58.23 (0.62%) |
57.84 |
53.46 - 59.89 |
1.2464 times |
Mon 31 March 2025 |
57.87 (3.47%) |
55.48 |
54.17 - 58.06 |
1.3908 times |
Fri 28 February 2025 |
55.93 (3.75%) |
53.15 |
51.66 - 55.95 |
0.9711 times |

DMA SMA EMA moving averages of Northwestern Corporation NWE
DMA (daily moving average) of Northwestern Corporation NWE
| DMA period | DMA value | | 5 day DMA | 67.31 | | 12 day DMA | 66.8 | | 20 day DMA | 66.3 | | 35 day DMA | 63.9 | | 50 day DMA | 62.06 | | 100 day DMA | 58.69 | | 150 day DMA | 57.19 | | 200 day DMA | 56.9 | EMA (exponential moving average) of Northwestern Corporation NWE
| EMA period | EMA current | EMA prev | EMA prev2 | | 5 day EMA | 66.75 | 67.29 | 67.58 | | 12 day EMA | 66.58 | 66.75 | 66.75 | | 20 day EMA | 65.75 | 65.76 | 65.66 | | 35 day EMA | 64.06 | 63.97 | 63.81 | | 50 day EMA | 62.09 | 61.94 | 61.74 |
SMA (simple moving average) of Northwestern Corporation NWE
| SMA period | SMA current | SMA prev | SMA prev2 | | 5 day SMA | 67.31 | 67.84 | 67.99 | | 12 day SMA | 66.8 | 66.76 | 66.63 | | 20 day SMA | 66.3 | 66.07 | 65.77 | | 35 day SMA | 63.9 | 63.71 | 63.47 | | 50 day SMA | 62.06 | 61.87 | 61.66 | | 100 day SMA | 58.69 | 58.57 | 58.42 | | 150 day SMA | 57.19 | 57.14 | 57.09 | | 200 day SMA | 56.9 | 56.84 | 56.78 |
|
|
