NveCorporation NVEC full analysis,charts,indicators,moving averages,SMA,DMA,EMA,ADX,MACD,RSINve Corporation NVEC WideScreen charts, DMA,SMA,EMA technical analysis, forecast prediction, by indicators ADX,MACD,RSI,CCI USA stock exchange
operates under Technology sector & deals in Semiconductors
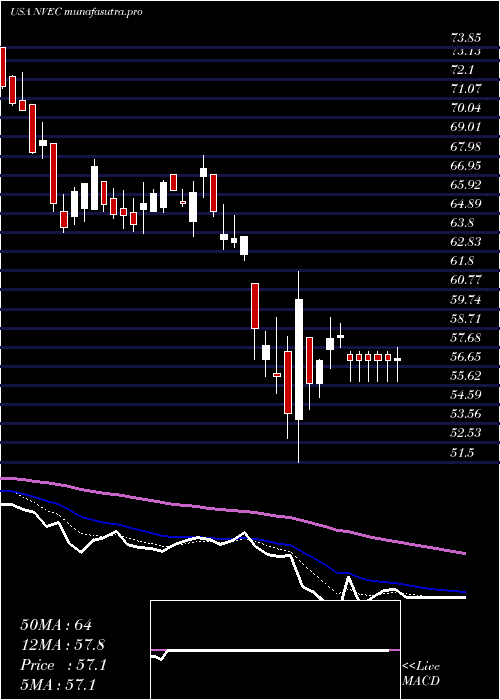
Daily price and charts and targets NveCorporation Strong Daily Stock price targets for NveCorporation NVEC are 66.53 and 68.51 | Daily Target 1 | 64.9 | | Daily Target 2 | 66.18 | | Daily Target 3 | 66.876666666667 | | Daily Target 4 | 68.16 | | Daily Target 5 | 68.86 |
Daily price and volume Nve Corporation
| Date |
Closing |
Open |
Range |
Volume |
Thu 04 December 2025 |
67.47 (1.89%) |
65.59 |
65.59 - 67.57 |
0.752 times |
Wed 03 December 2025 |
66.22 (5.19%) |
63.51 |
63.42 - 66.46 |
0.993 times |
Tue 02 December 2025 |
62.95 (-1.1%) |
64.24 |
62.71 - 64.50 |
1.1763 times |
Mon 01 December 2025 |
63.65 (-0.45%) |
63.26 |
62.88 - 64.42 |
0.9909 times |
Fri 28 November 2025 |
63.94 (2.03%) |
62.89 |
62.37 - 64.06 |
1.0218 times |
Wed 26 November 2025 |
62.67 (0.97%) |
61.54 |
61.54 - 63.89 |
1.0363 times |
Tue 25 November 2025 |
62.07 (3.26%) |
60.52 |
60.36 - 62.26 |
1.2176 times |
Mon 24 November 2025 |
60.11 (0.67%) |
59.79 |
59.65 - 61.13 |
1.3391 times |
Fri 21 November 2025 |
59.71 (3.99%) |
57.22 |
57.22 - 60.93 |
0.7767 times |
Thu 20 November 2025 |
57.42 (-1.41%) |
59.87 |
57.21 - 59.97 |
0.6963 times |
Wed 19 November 2025 |
58.24 (0.28%) |
58.52 |
58.08 - 59.21 |
0.7726 times |
Weekly price and charts NveCorporation Strong weekly Stock price targets for NveCorporation NVEC are 65.09 and 69.95 | Weekly Target 1 | 61.06 | | Weekly Target 2 | 64.26 | | Weekly Target 3 | 65.916666666667 | | Weekly Target 4 | 69.12 | | Weekly Target 5 | 70.78 |
Weekly price and volumes for Nve Corporation
| Date |
Closing |
Open |
Range |
Volume |
Thu 04 December 2025 |
67.47 (5.52%) |
63.26 |
62.71 - 67.57 |
0.9999 times |
Fri 28 November 2025 |
63.94 (7.08%) |
59.79 |
59.65 - 64.06 |
1.1795 times |
Fri 21 November 2025 |
59.71 (-3.62%) |
61.67 |
57.21 - 61.95 |
1.2627 times |
Fri 14 November 2025 |
61.95 (-4.65%) |
65.59 |
61.64 - 66.26 |
1.2322 times |
Fri 07 November 2025 |
64.97 (-5.91%) |
66.49 |
63.22 - 67.79 |
0.8883 times |
Fri 31 October 2025 |
69.05 (0%) |
68.45 |
67.52 - 69.75 |
0.159 times |
Fri 31 October 2025 |
69.05 (-5.11%) |
74.18 |
67.52 - 75.67 |
0.9573 times |
Fri 24 October 2025 |
72.77 (1.11%) |
72.97 |
70.01 - 79.98 |
1.1305 times |
Fri 17 October 2025 |
71.97 (7.02%) |
67.99 |
67.99 - 75.98 |
1.1326 times |
Fri 10 October 2025 |
67.25 (-1.74%) |
68.44 |
66.42 - 70.87 |
1.0579 times |
Fri 03 October 2025 |
68.44 (5.02%) |
65.73 |
64.38 - 68.77 |
0.8562 times |
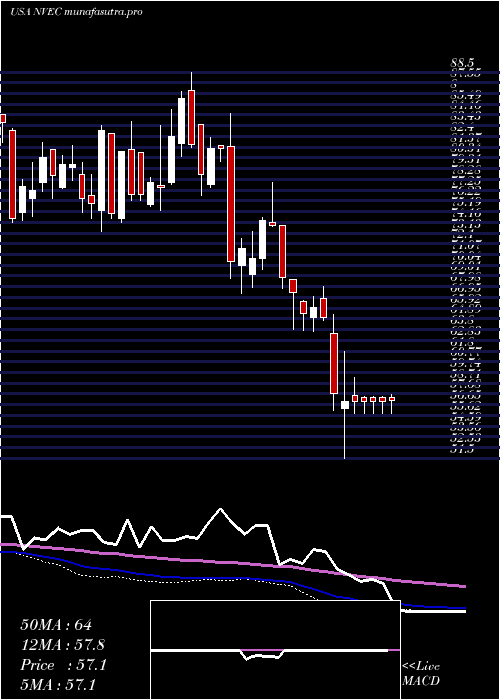
Monthly price and charts NveCorporation Strong monthly Stock price targets for NveCorporation NVEC are 65.09 and 69.95 | Monthly Target 1 | 61.06 | | Monthly Target 2 | 64.26 | | Monthly Target 3 | 65.916666666667 | | Monthly Target 4 | 69.12 | | Monthly Target 5 | 70.78 |
Monthly price and volumes Nve Corporation
| Date |
Closing |
Open |
Range |
Volume |
Thu 04 December 2025 |
67.47 (5.52%) |
63.26 |
62.71 - 67.57 |
0.2144 times |
Fri 28 November 2025 |
63.94 (-7.4%) |
66.49 |
57.21 - 67.79 |
0.9785 times |
Fri 31 October 2025 |
69.05 (5.79%) |
64.75 |
64.58 - 79.98 |
1.0695 times |
Tue 30 September 2025 |
65.27 (1.07%) |
64.00 |
63.01 - 68.58 |
0.862 times |
Fri 29 August 2025 |
64.58 (1.97%) |
61.78 |
59.25 - 67.11 |
1.0872 times |
Thu 31 July 2025 |
63.33 (-13.97%) |
73.07 |
62.00 - 81.88 |
1.927 times |
Mon 30 June 2025 |
73.61 (3.44%) |
71.16 |
67.81 - 75.50 |
1.9829 times |
Fri 30 May 2025 |
71.16 (22.46%) |
58.79 |
57.00 - 74.95 |
0.7989 times |
Wed 30 April 2025 |
58.11 (-8.83%) |
63.30 |
51.50 - 64.76 |
0.6292 times |
Mon 31 March 2025 |
63.74 (-7.41%) |
68.64 |
62.96 - 68.65 |
0.4504 times |
Fri 28 February 2025 |
68.84 (-3.94%) |
69.15 |
67.82 - 78.00 |
0.4625 times |

DMA SMA EMA moving averages of Nve Corporation NVEC
DMA (daily moving average) of Nve Corporation NVEC
| DMA period | DMA value | | 5 day DMA | 64.85 | | 12 day DMA | 61.88 | | 20 day DMA | 62.66 | | 35 day DMA | 66.21 | | 50 day DMA | 66.76 | | 100 day DMA | 66.6 | | 150 day DMA | 68.19 | | 200 day DMA | 66.88 | EMA (exponential moving average) of Nve Corporation NVEC
| EMA period | EMA current | EMA prev | EMA prev2 | | 5 day EMA | 65.08 | 63.89 | 62.73 | | 12 day EMA | 63.69 | 63 | 62.41 | | 20 day EMA | 63.88 | 63.5 | 63.21 | | 35 day EMA | 64.79 | 64.63 | 64.54 | | 50 day EMA | 66.59 | 66.55 | 66.56 |
SMA (simple moving average) of Nve Corporation NVEC
| SMA period | SMA current | SMA prev | SMA prev2 | | 5 day SMA | 64.85 | 63.89 | 63.06 | | 12 day SMA | 61.88 | 61.21 | 60.86 | | 20 day SMA | 62.66 | 62.65 | 62.62 | | 35 day SMA | 66.21 | 66.43 | 66.61 | | 50 day SMA | 66.76 | 66.74 | 66.76 | | 100 day SMA | 66.6 | 66.71 | 66.81 | | 150 day SMA | 68.19 | 68.12 | 68.07 | | 200 day SMA | 66.88 | 66.92 | 66.96 |
|
|
