NucorCorporation NUE full analysis,charts,indicators,moving averages,SMA,DMA,EMA,ADX,MACD,RSINucor Corporation NUE WideScreen charts, DMA,SMA,EMA technical analysis, forecast prediction, by indicators ADX,MACD,RSI,CCI USA stock exchange
operates under Basic Industries sector & deals in Steel Iron Ore
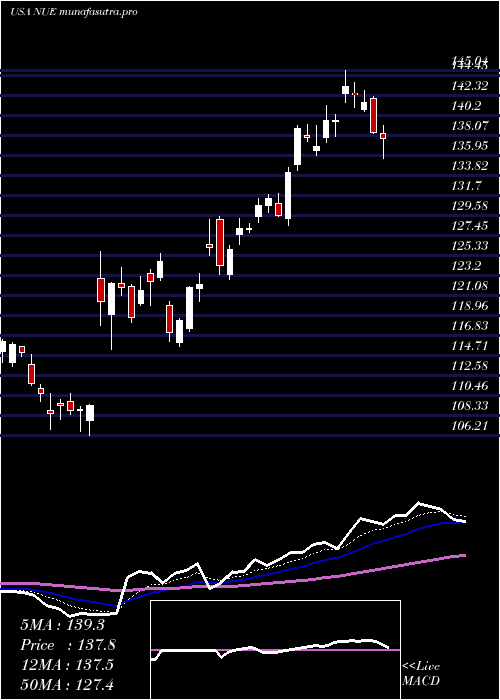
Daily price and charts and targets NucorCorporation Strong Daily Stock price targets for NucorCorporation NUE are 157.48 and 161.12 | Daily Target 1 | 156.82 | | Daily Target 2 | 158.13 | | Daily Target 3 | 160.45666666667 | | Daily Target 4 | 161.77 | | Daily Target 5 | 164.1 |
Daily price and volume Nucor Corporation
| Date |
Closing |
Open |
Range |
Volume |
Fri 05 December 2025 |
159.45 (-1.9%) |
162.59 |
159.14 - 162.78 |
1.4187 times |
Thu 04 December 2025 |
162.54 (-1.32%) |
164.00 |
160.54 - 164.71 |
1.0603 times |
Wed 03 December 2025 |
164.71 (2.25%) |
161.14 |
160.72 - 166.27 |
1.5798 times |
Tue 02 December 2025 |
161.09 (0.24%) |
161.62 |
160.18 - 161.94 |
0.6898 times |
Mon 01 December 2025 |
160.70 (0.76%) |
158.73 |
158.65 - 162.22 |
0.788 times |
Fri 28 November 2025 |
159.49 (0.23%) |
159.45 |
158.63 - 159.95 |
0.4345 times |
Wed 26 November 2025 |
159.13 (1.84%) |
156.25 |
155.98 - 159.42 |
0.7747 times |
Tue 25 November 2025 |
156.25 (1.69%) |
154.50 |
153.63 - 157.84 |
0.9809 times |
Mon 24 November 2025 |
153.65 (0.85%) |
151.72 |
150.86 - 153.93 |
1.1788 times |
Fri 21 November 2025 |
152.35 (3.5%) |
147.00 |
146.00 - 152.67 |
1.0945 times |
Thu 20 November 2025 |
147.20 (-0.93%) |
149.84 |
147.16 - 153.60 |
1.0005 times |
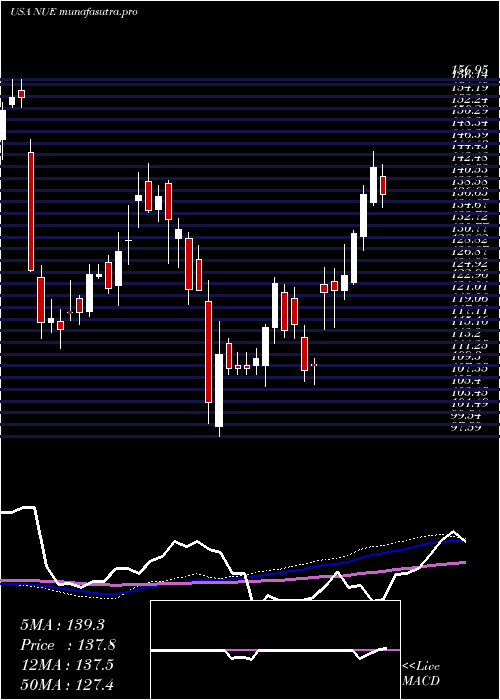
Weekly price and charts NucorCorporation Strong weekly Stock price targets for NucorCorporation NUE are 159.05 and 166.67 | Weekly Target 1 | 153.84 | | Weekly Target 2 | 156.64 | | Weekly Target 3 | 161.45666666667 | | Weekly Target 4 | 164.26 | | Weekly Target 5 | 169.08 |
Weekly price and volumes for Nucor Corporation
| Date |
Closing |
Open |
Range |
Volume |
Fri 05 December 2025 |
159.45 (-0.03%) |
158.73 |
158.65 - 166.27 |
1.2315 times |
Fri 28 November 2025 |
159.49 (4.69%) |
151.72 |
150.86 - 159.95 |
0.7493 times |
Fri 21 November 2025 |
152.35 (3.09%) |
147.01 |
146.00 - 153.60 |
1.1007 times |
Fri 14 November 2025 |
147.78 (2.4%) |
144.78 |
140.93 - 150.62 |
0.9329 times |
Fri 07 November 2025 |
144.31 (-3.83%) |
145.40 |
142.05 - 147.35 |
0.8857 times |
Fri 31 October 2025 |
150.05 (0%) |
149.50 |
147.85 - 152.00 |
0.3185 times |
Fri 31 October 2025 |
150.05 (8.18%) |
140.22 |
139.21 - 155.83 |
1.9528 times |
Fri 24 October 2025 |
138.70 (5.25%) |
134.55 |
133.78 - 141.97 |
0.8598 times |
Fri 17 October 2025 |
131.78 (-1.4%) |
136.51 |
131.32 - 139.78 |
0.9779 times |
Fri 10 October 2025 |
133.65 (-3.18%) |
138.18 |
133.61 - 141.61 |
0.9909 times |
Fri 03 October 2025 |
138.04 (-0.07%) |
138.59 |
134.27 - 139.83 |
1.1446 times |
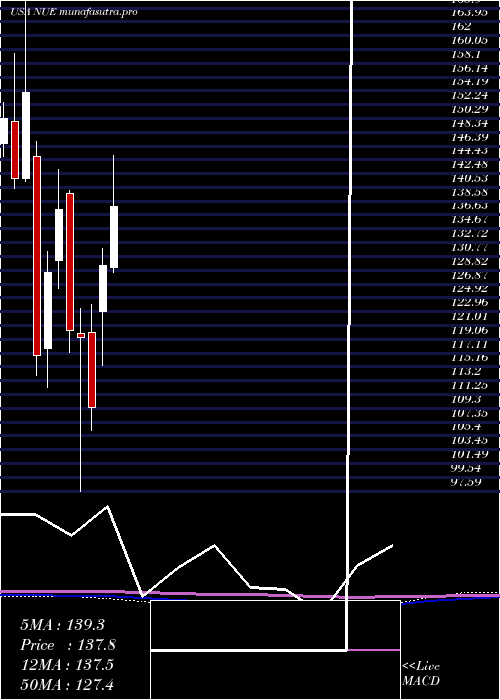
Monthly price and charts NucorCorporation Strong monthly Stock price targets for NucorCorporation NUE are 159.05 and 166.67 | Monthly Target 1 | 153.84 | | Monthly Target 2 | 156.64 | | Monthly Target 3 | 161.45666666667 | | Monthly Target 4 | 164.26 | | Monthly Target 5 | 169.08 |
Monthly price and volumes Nucor Corporation
| Date |
Closing |
Open |
Range |
Volume |
Fri 05 December 2025 |
159.45 (-0.03%) |
158.73 |
158.65 - 166.27 |
0.2015 times |
Fri 28 November 2025 |
159.49 (6.29%) |
145.40 |
140.93 - 159.95 |
0.6004 times |
Fri 31 October 2025 |
150.05 (10.8%) |
135.23 |
131.32 - 155.83 |
0.9215 times |
Tue 30 September 2025 |
135.43 (-8.94%) |
145.96 |
131.93 - 150.24 |
1.0174 times |
Fri 29 August 2025 |
148.73 (3.96%) |
139.38 |
135.80 - 151.32 |
0.6685 times |
Thu 31 July 2025 |
143.07 (10.44%) |
129.23 |
128.46 - 147.15 |
1.0715 times |
Mon 30 June 2025 |
129.54 (18.45%) |
122.91 |
115.35 - 131.88 |
1.4542 times |
Fri 30 May 2025 |
109.36 (-8.39%) |
120.00 |
106.21 - 123.95 |
1.1657 times |
Wed 30 April 2025 |
119.37 (-0.81%) |
119.92 |
97.59 - 123.45 |
1.2778 times |
Mon 31 March 2025 |
120.34 (-12.46%) |
139.66 |
117.12 - 140.12 |
1.6215 times |
Fri 28 February 2025 |
137.47 (7.04%) |
130.19 |
126.23 - 143.06 |
1.445 times |
DMA SMA EMA moving averages of Nucor Corporation NUE
DMA (daily moving average) of Nucor Corporation NUE
| DMA period | DMA value | | 5 day DMA | 161.7 | | 12 day DMA | 157.1 | | 20 day DMA | 152.77 | | 35 day DMA | 148.93 | | 50 day DMA | 145.21 | | 100 day DMA | 143.92 | | 150 day DMA | 137.14 | | 200 day DMA | 133.32 | EMA (exponential moving average) of Nucor Corporation NUE
| EMA period | EMA current | EMA prev | EMA prev2 | | 5 day EMA | 160.75 | 161.4 | 160.83 | | 12 day EMA | 157.66 | 157.34 | 156.4 | | 20 day EMA | 154.55 | 154.03 | 153.14 | | 35 day EMA | 149.95 | 149.39 | 148.62 | | 50 day EMA | 146 | 145.45 | 144.75 |
SMA (simple moving average) of Nucor Corporation NUE
| SMA period | SMA current | SMA prev | SMA prev2 | | 5 day SMA | 161.7 | 161.71 | 161.02 | | 12 day SMA | 157.1 | 156.18 | 155.03 | | 20 day SMA | 152.77 | 152.03 | 151.16 | | 35 day SMA | 148.93 | 148.16 | 147.42 | | 50 day SMA | 145.21 | 144.72 | 144.2 | | 100 day SMA | 143.92 | 143.7 | 143.46 | | 150 day SMA | 137.14 | 136.87 | 136.59 | | 200 day SMA | 133.32 | 133.23 | 133.13 |
|
|
