NorthernTrust NTRS full analysis,charts,indicators,moving averages,SMA,DMA,EMA,ADX,MACD,RSINorthern Trust NTRS WideScreen charts, DMA,SMA,EMA technical analysis, forecast prediction, by indicators ADX,MACD,RSI,CCI USA stock exchange
operates under Finance sector & deals in Major Banks
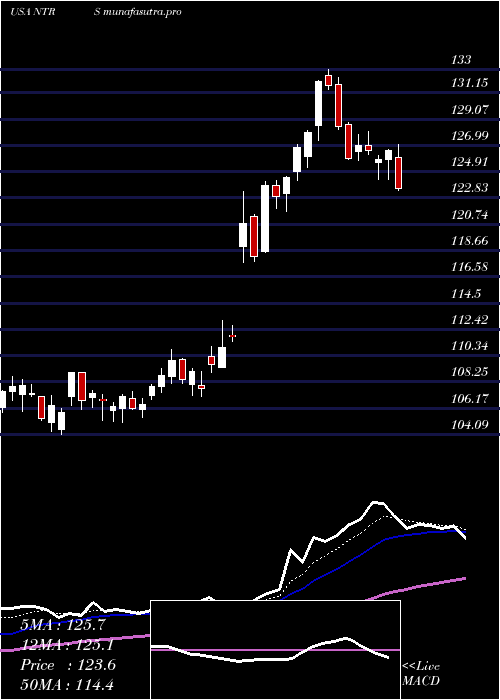
Daily price and charts and targets NorthernTrust Strong Daily Stock price targets for NorthernTrust NTRS are 132.61 and 134.41 | Daily Target 1 | 131.2 | | Daily Target 2 | 132.21 | | Daily Target 3 | 133.00333333333 | | Daily Target 4 | 134.01 | | Daily Target 5 | 134.8 |
Daily price and volume Northern Trust
| Date |
Closing |
Open |
Range |
Volume |
Thu 04 December 2025 |
133.21 (0.79%) |
132.00 |
132.00 - 133.80 |
0.8857 times |
Wed 03 December 2025 |
132.16 (1.33%) |
130.40 |
130.40 - 132.24 |
1.0274 times |
Tue 02 December 2025 |
130.43 (-0.42%) |
131.62 |
130.37 - 132.05 |
0.8304 times |
Mon 01 December 2025 |
130.98 (-0.27%) |
129.98 |
129.98 - 132.05 |
0.9826 times |
Fri 28 November 2025 |
131.34 (-0.02%) |
131.51 |
131.15 - 132.55 |
0.467 times |
Wed 26 November 2025 |
131.37 (1.11%) |
130.11 |
129.78 - 132.17 |
0.6669 times |
Tue 25 November 2025 |
129.93 (0.92%) |
129.26 |
128.27 - 130.82 |
0.9435 times |
Mon 24 November 2025 |
128.75 (1.27%) |
126.42 |
126.24 - 129.26 |
2.0992 times |
Fri 21 November 2025 |
127.13 (1.12%) |
125.72 |
124.91 - 128.30 |
1.0707 times |
Thu 20 November 2025 |
125.72 (-0.23%) |
127.92 |
124.95 - 129.14 |
1.0267 times |
Wed 19 November 2025 |
126.01 (0.99%) |
124.72 |
124.25 - 126.40 |
0.8497 times |
Weekly price and charts NorthernTrust Strong weekly Stock price targets for NorthernTrust NTRS are 131.6 and 135.42 | Weekly Target 1 | 128.51 | | Weekly Target 2 | 130.86 | | Weekly Target 3 | 132.33 | | Weekly Target 4 | 134.68 | | Weekly Target 5 | 136.15 |
Weekly price and volumes for Northern Trust
| Date |
Closing |
Open |
Range |
Volume |
Thu 04 December 2025 |
133.21 (1.42%) |
129.98 |
129.98 - 133.80 |
0.7812 times |
Fri 28 November 2025 |
131.34 (3.31%) |
126.42 |
126.24 - 132.55 |
0.8756 times |
Fri 21 November 2025 |
127.13 (-0.2%) |
127.40 |
121.53 - 129.14 |
1.1099 times |
Fri 14 November 2025 |
127.39 (-1.98%) |
130.10 |
126.49 - 134.57 |
1.0413 times |
Fri 07 November 2025 |
129.96 (1%) |
126.71 |
126.25 - 130.58 |
0.7313 times |
Fri 31 October 2025 |
128.67 (0%) |
126.90 |
125.99 - 129.03 |
0.2538 times |
Fri 31 October 2025 |
128.67 (2.09%) |
126.97 |
125.29 - 129.51 |
1.2057 times |
Fri 24 October 2025 |
126.03 (0.97%) |
125.97 |
122.78 - 130.19 |
1.3762 times |
Fri 17 October 2025 |
124.82 (0.08%) |
125.60 |
121.12 - 130.81 |
1.293 times |
Fri 10 October 2025 |
124.72 (-5.8%) |
133.25 |
124.42 - 133.92 |
1.3319 times |
Fri 03 October 2025 |
132.40 (-0.68%) |
133.99 |
130.19 - 135.48 |
1.1918 times |

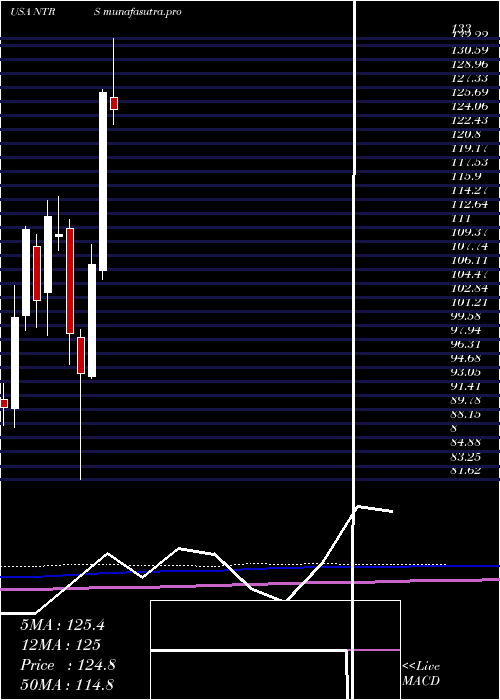
Monthly price and charts NorthernTrust Strong monthly Stock price targets for NorthernTrust NTRS are 131.6 and 135.42 | Monthly Target 1 | 128.51 | | Monthly Target 2 | 130.86 | | Monthly Target 3 | 132.33 | | Monthly Target 4 | 134.68 | | Monthly Target 5 | 136.15 |
Monthly price and volumes Northern Trust
| Date |
Closing |
Open |
Range |
Volume |
Thu 04 December 2025 |
133.21 (1.42%) |
129.98 |
129.98 - 133.80 |
0.1279 times |
Fri 28 November 2025 |
131.34 (2.08%) |
126.71 |
121.53 - 134.57 |
0.6155 times |
Fri 31 October 2025 |
128.67 (-4.41%) |
133.61 |
121.12 - 134.54 |
1.0001 times |
Tue 30 September 2025 |
134.60 (2.53%) |
129.70 |
125.25 - 135.48 |
0.925 times |
Fri 29 August 2025 |
131.28 (0.98%) |
127.73 |
124.44 - 132.63 |
0.7821 times |
Thu 31 July 2025 |
130.00 (2.53%) |
126.12 |
118.99 - 133.00 |
1.3475 times |
Mon 30 June 2025 |
126.79 (18.78%) |
105.98 |
104.99 - 127.09 |
1.9279 times |
Fri 30 May 2025 |
106.74 (13.58%) |
93.65 |
93.42 - 109.03 |
1.203 times |
Wed 30 April 2025 |
93.98 (-4.73%) |
98.19 |
81.62 - 99.21 |
1.1017 times |
Mon 31 March 2025 |
98.65 (-10.5%) |
110.97 |
95.05 - 111.92 |
0.9693 times |
Fri 28 February 2025 |
110.22 (-1.84%) |
109.98 |
108.34 - 114.67 |
0.8599 times |
DMA SMA EMA moving averages of Northern Trust NTRS
DMA (daily moving average) of Northern Trust NTRS
| DMA period | DMA value | | 5 day DMA | 131.62 | | 12 day DMA | 129.32 | | 20 day DMA | 129.1 | | 35 day DMA | 128.16 | | 50 day DMA | 129.04 | | 100 day DMA | 128.82 | | 150 day DMA | 123.25 | | 200 day DMA | 116.87 | EMA (exponential moving average) of Northern Trust NTRS
| EMA period | EMA current | EMA prev | EMA prev2 | | 5 day EMA | 131.69 | 130.93 | 130.32 | | 12 day EMA | 130.27 | 129.73 | 129.29 | | 20 day EMA | 129.59 | 129.21 | 128.9 | | 35 day EMA | 129.41 | 129.19 | 129.01 | | 50 day EMA | 129.46 | 129.31 | 129.19 |
SMA (simple moving average) of Northern Trust NTRS
| SMA period | SMA current | SMA prev | SMA prev2 | | 5 day SMA | 131.62 | 131.26 | 130.81 | | 12 day SMA | 129.32 | 128.44 | 128.05 | | 20 day SMA | 129.1 | 128.85 | 128.62 | | 35 day SMA | 128.16 | 128.07 | 127.98 | | 50 day SMA | 129.04 | 128.96 | 128.93 | | 100 day SMA | 128.82 | 128.72 | 128.67 | | 150 day SMA | 123.25 | 122.99 | 122.73 | | 200 day SMA | 116.87 | 116.76 | 116.65 |
|
|
