NorthernTechnologies NTIC full analysis,charts,indicators,moving averages,SMA,DMA,EMA,ADX,MACD,RSINorthern Technologies NTIC WideScreen charts, DMA,SMA,EMA technical analysis, forecast prediction, by indicators ADX,MACD,RSI,CCI USA stock exchange
operates under Capital Goods sector & deals in Industrial Specialties
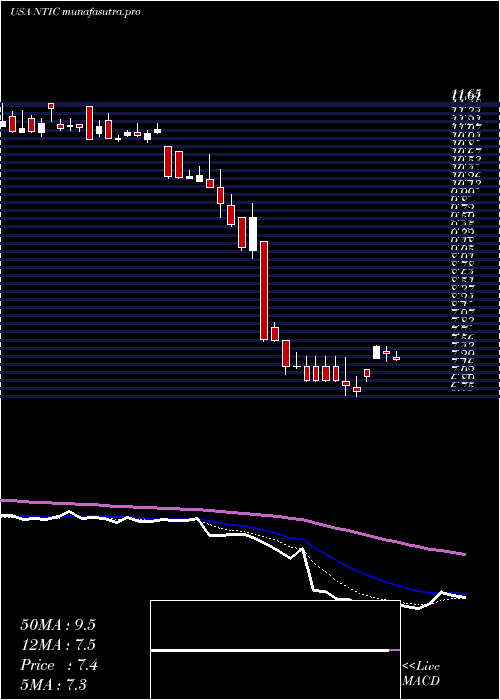
Daily price and charts and targets NorthernTechnologies Strong Daily Stock price targets for NorthernTechnologies NTIC are 7.33 and 7.43 | Daily Target 1 | 7.3 | | Daily Target 2 | 7.35 | | Daily Target 3 | 7.4 | | Daily Target 4 | 7.45 | | Daily Target 5 | 7.5 |
Daily price and volume Northern Technologies
| Date |
Closing |
Open |
Range |
Volume |
Thu 04 December 2025 |
7.40 (0%) |
7.44 |
7.35 - 7.45 |
1.001 times |
Wed 03 December 2025 |
7.40 (0.54%) |
7.43 |
7.40 - 7.47 |
0.4989 times |
Tue 02 December 2025 |
7.36 (-0.54%) |
7.40 |
7.36 - 7.47 |
1.3003 times |
Mon 01 December 2025 |
7.40 (-0.54%) |
7.48 |
7.40 - 7.48 |
1.1941 times |
Fri 28 November 2025 |
7.44 (-0.4%) |
7.49 |
7.40 - 7.54 |
1.1072 times |
Wed 26 November 2025 |
7.47 (-0.13%) |
7.53 |
7.47 - 7.57 |
1.075 times |
Tue 25 November 2025 |
7.48 (0%) |
7.48 |
7.48 - 7.54 |
1.0171 times |
Mon 24 November 2025 |
7.48 (-0.66%) |
7.51 |
7.47 - 7.54 |
1.3808 times |
Fri 21 November 2025 |
7.53 (0.13%) |
7.51 |
7.47 - 7.57 |
0.5117 times |
Thu 20 November 2025 |
7.52 (1.08%) |
7.54 |
7.45 - 7.75 |
0.9141 times |
Wed 19 November 2025 |
7.44 (-0.53%) |
7.45 |
7.40 - 7.92 |
1.8056 times |
Weekly price and charts NorthernTechnologies Strong weekly Stock price targets for NorthernTechnologies NTIC are 7.31 and 7.44 | Weekly Target 1 | 7.28 | | Weekly Target 2 | 7.34 | | Weekly Target 3 | 7.41 | | Weekly Target 4 | 7.47 | | Weekly Target 5 | 7.54 |
Weekly price and volumes for Northern Technologies
| Date |
Closing |
Open |
Range |
Volume |
Thu 04 December 2025 |
7.40 (-0.54%) |
7.48 |
7.35 - 7.48 |
1.1371 times |
Fri 28 November 2025 |
7.44 (-1.2%) |
7.51 |
7.40 - 7.57 |
1.3038 times |
Fri 21 November 2025 |
7.53 (-6.58%) |
8.05 |
7.38 - 8.08 |
2.3749 times |
Fri 14 November 2025 |
8.06 (-0.49%) |
8.12 |
8.06 - 8.27 |
0.3335 times |
Fri 07 November 2025 |
8.10 (9.02%) |
7.65 |
7.65 - 8.31 |
0.4306 times |
Fri 31 October 2025 |
7.43 (0%) |
7.51 |
7.43 - 7.76 |
0.3372 times |
Fri 31 October 2025 |
7.43 (-4.87%) |
7.77 |
7.43 - 7.81 |
1.0381 times |
Fri 24 October 2025 |
7.81 (5.26%) |
7.55 |
7.40 - 7.92 |
1.2901 times |
Fri 17 October 2025 |
7.42 (-4.5%) |
7.88 |
7.42 - 7.99 |
0.7238 times |
Fri 10 October 2025 |
7.77 (3.19%) |
7.61 |
7.60 - 8.32 |
1.0308 times |
Fri 03 October 2025 |
7.53 (-3.46%) |
7.80 |
7.52 - 7.94 |
0.6257 times |
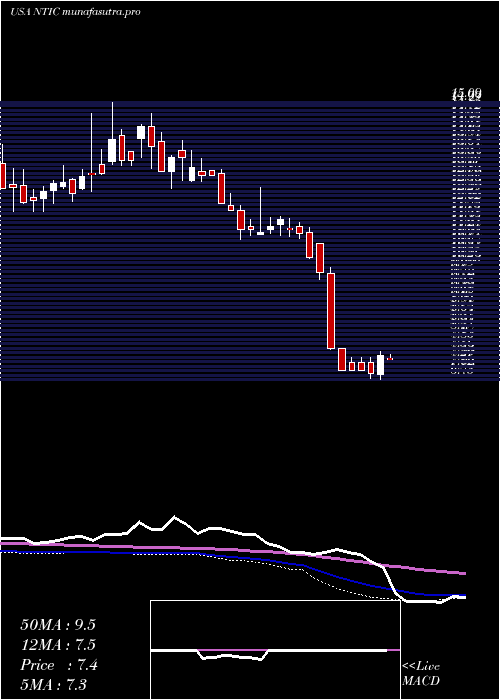
Monthly price and charts NorthernTechnologies Strong monthly Stock price targets for NorthernTechnologies NTIC are 7.31 and 7.44 | Monthly Target 1 | 7.28 | | Monthly Target 2 | 7.34 | | Monthly Target 3 | 7.41 | | Monthly Target 4 | 7.47 | | Monthly Target 5 | 7.54 |
Monthly price and volumes Northern Technologies
| Date |
Closing |
Open |
Range |
Volume |
Thu 04 December 2025 |
7.40 (-0.54%) |
7.48 |
7.35 - 7.48 |
0.2039 times |
Fri 28 November 2025 |
7.44 (0.13%) |
7.65 |
7.38 - 8.31 |
0.7967 times |
Fri 31 October 2025 |
7.43 (-3.63%) |
7.66 |
7.40 - 8.32 |
0.8526 times |
Tue 30 September 2025 |
7.71 (4.19%) |
7.40 |
7.25 - 8.15 |
0.5588 times |
Fri 29 August 2025 |
7.40 (-3.9%) |
7.50 |
7.15 - 7.90 |
0.6034 times |
Thu 31 July 2025 |
7.70 (3.91%) |
7.42 |
7.14 - 8.97 |
1.2918 times |
Mon 30 June 2025 |
7.41 (2.49%) |
7.25 |
7.15 - 8.67 |
2.6643 times |
Fri 30 May 2025 |
7.23 (-2.95%) |
7.41 |
7.10 - 7.60 |
0.9285 times |
Wed 30 April 2025 |
7.45 (-28.43%) |
10.40 |
6.75 - 10.80 |
1.5888 times |
Mon 31 March 2025 |
10.41 (-8.28%) |
11.43 |
10.40 - 11.65 |
0.5112 times |
Fri 28 February 2025 |
11.35 (-4.14%) |
11.83 |
10.96 - 12.53 |
0.5053 times |

DMA SMA EMA moving averages of Northern Technologies NTIC
DMA (daily moving average) of Northern Technologies NTIC
| DMA period | DMA value | | 5 day DMA | 7.4 | | 12 day DMA | 7.45 | | 20 day DMA | 7.7 | | 35 day DMA | 7.69 | | 50 day DMA | 7.71 | | 100 day DMA | 7.69 | | 150 day DMA | 7.65 | | 200 day DMA | 8.17 | EMA (exponential moving average) of Northern Technologies NTIC
| EMA period | EMA current | EMA prev | EMA prev2 | | 5 day EMA | 7.41 | 7.42 | 7.43 | | 12 day EMA | 7.51 | 7.53 | 7.55 | | 20 day EMA | 7.58 | 7.6 | 7.62 | | 35 day EMA | 7.64 | 7.65 | 7.66 | | 50 day EMA | 7.7 | 7.71 | 7.72 |
SMA (simple moving average) of Northern Technologies NTIC
| SMA period | SMA current | SMA prev | SMA prev2 | | 5 day SMA | 7.4 | 7.41 | 7.43 | | 12 day SMA | 7.45 | 7.5 | 7.55 | | 20 day SMA | 7.7 | 7.74 | 7.78 | | 35 day SMA | 7.69 | 7.69 | 7.7 | | 50 day SMA | 7.71 | 7.72 | 7.73 | | 100 day SMA | 7.69 | 7.7 | 7.71 | | 150 day SMA | 7.65 | 7.65 | 7.65 | | 200 day SMA | 8.17 | 8.19 | 8.21 |
|
|
