NeteaseInc NTES full analysis,charts,indicators,moving averages,SMA,DMA,EMA,ADX,MACD,RSINetease Inc NTES WideScreen charts, DMA,SMA,EMA technical analysis, forecast prediction, by indicators ADX,MACD,RSI,CCI USA stock exchange
operates under Miscellaneous sector & deals in Business Services
Daily price and charts and targets NeteaseInc Strong Daily Stock price targets for NeteaseInc NTES are 151.23 and 154.72 | Daily Target 1 | 148.36 | | Daily Target 2 | 150.61 | | Daily Target 3 | 151.85333333333 | | Daily Target 4 | 154.1 | | Daily Target 5 | 155.34 |
Daily price and volume Netease Inc
| Date |
Closing |
Open |
Range |
Volume |
Mon 20 October 2025 |
152.85 (3.13%) |
150.13 |
149.61 - 153.10 |
0.8528 times |
Fri 17 October 2025 |
148.21 (-0.26%) |
145.69 |
145.16 - 149.16 |
1.3092 times |
Thu 16 October 2025 |
148.60 (0.12%) |
148.63 |
148.16 - 150.77 |
0.6993 times |
Wed 15 October 2025 |
148.42 (1.66%) |
149.00 |
146.93 - 149.13 |
1.2119 times |
Tue 14 October 2025 |
145.99 (-2.26%) |
146.77 |
145.87 - 148.26 |
0.8307 times |
Mon 13 October 2025 |
149.37 (1.67%) |
150.19 |
148.40 - 150.28 |
1.1326 times |
Fri 10 October 2025 |
146.91 (-3.12%) |
154.44 |
145.24 - 156.44 |
2.292 times |
Thu 09 October 2025 |
151.64 (-1.49%) |
154.07 |
151.10 - 154.73 |
0.5837 times |
Wed 08 October 2025 |
153.93 (2.9%) |
154.00 |
153.21 - 155.00 |
0.6145 times |
Tue 07 October 2025 |
149.59 (-0.96%) |
151.04 |
149.40 - 151.20 |
0.4734 times |
Mon 06 October 2025 |
151.04 (-0.35%) |
149.72 |
148.92 - 151.72 |
0.3147 times |
Weekly price and charts NeteaseInc Strong weekly Stock price targets for NeteaseInc NTES are 151.23 and 154.72 | Weekly Target 1 | 148.36 | | Weekly Target 2 | 150.61 | | Weekly Target 3 | 151.85333333333 | | Weekly Target 4 | 154.1 | | Weekly Target 5 | 155.34 |
Weekly price and volumes for Netease Inc
| Date |
Closing |
Open |
Range |
Volume |
Mon 20 October 2025 |
152.85 (3.13%) |
150.13 |
149.61 - 153.10 |
0.2006 times |
Fri 17 October 2025 |
148.21 (0.88%) |
150.19 |
145.16 - 150.77 |
1.2192 times |
Fri 10 October 2025 |
146.91 (-3.07%) |
149.72 |
145.24 - 156.44 |
1.0063 times |
Fri 03 October 2025 |
151.57 (2.68%) |
149.48 |
149.23 - 154.41 |
1.0613 times |
Fri 26 September 2025 |
147.62 (-2.91%) |
150.23 |
144.85 - 154.52 |
1.2585 times |
Fri 19 September 2025 |
152.05 (-0.49%) |
155.00 |
151.80 - 159.55 |
1.3412 times |
Fri 12 September 2025 |
152.80 (13.8%) |
140.88 |
140.54 - 152.91 |
1.3138 times |
Fri 05 September 2025 |
134.27 (-1.41%) |
135.50 |
131.91 - 136.42 |
0.7966 times |
Fri 29 August 2025 |
136.19 (0%) |
137.31 |
135.66 - 137.31 |
0.1635 times |
Fri 29 August 2025 |
136.19 (3.26%) |
136.90 |
134.26 - 139.20 |
1.639 times |
Fri 22 August 2025 |
131.89 (2.07%) |
130.92 |
127.70 - 132.64 |
1.1656 times |

Monthly price and charts NeteaseInc Strong monthly Stock price targets for NeteaseInc NTES are 149.01 and 160.29 | Monthly Target 1 | 140.2 | | Monthly Target 2 | 146.53 | | Monthly Target 3 | 151.48333333333 | | Monthly Target 4 | 157.81 | | Monthly Target 5 | 162.76 |
Monthly price and volumes Netease Inc
| Date |
Closing |
Open |
Range |
Volume |
Mon 20 October 2025 |
152.85 (0.57%) |
151.97 |
145.16 - 156.44 |
0.3765 times |
Tue 30 September 2025 |
151.99 (11.6%) |
135.50 |
131.91 - 159.55 |
0.6405 times |
Fri 29 August 2025 |
136.19 (4.52%) |
127.78 |
122.24 - 139.22 |
0.8477 times |
Thu 31 July 2025 |
130.30 (-3.18%) |
134.58 |
126.46 - 141.45 |
0.6045 times |
Mon 30 June 2025 |
134.58 (10.53%) |
122.31 |
122.27 - 135.23 |
0.8038 times |
Fri 30 May 2025 |
121.76 (13.73%) |
107.06 |
103.23 - 126.81 |
1.1491 times |
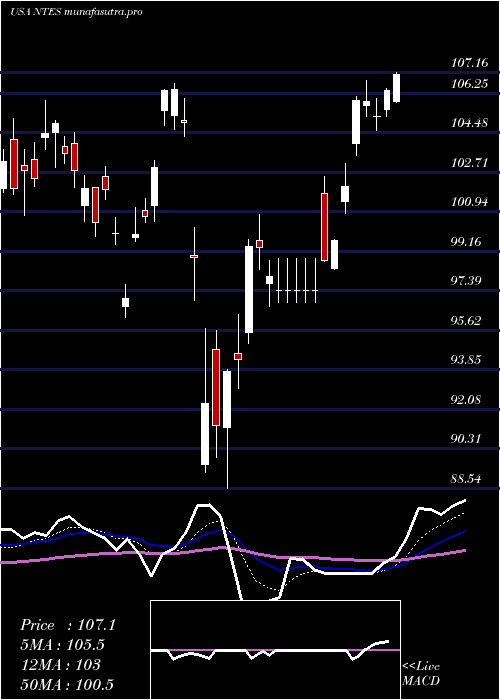
Wed 30 April 2025 |
107.06 (4.02%) |
105.48 |
88.54 - 107.16 |
1.8136 times |
Mon 31 March 2025 |
102.92 (3.21%) |
98.33 |
96.20 - 105.93 |
1.1894 times |
Fri 28 February 2025 |
99.72 (-3.04%) |
101.05 |
96.72 - 110.15 |
1.2033 times |
Fri 31 January 2025 |
102.85 (15.29%) |
88.51 |
87.67 - 105.58 |
1.3716 times |
Tue 31 December 2024 |
89.21 (3.48%) |
100.00 |
88.69 - 102.40 |
0.6367 times |

DMA SMA EMA moving averages of Netease Inc NTES
DMA (daily moving average) of Netease Inc NTES
| DMA period | DMA value | | 5 day DMA | 148.81 | | 12 day DMA | 149.84 | | 20 day DMA | 150.32 | | 35 day DMA | 148.84 | | 50 day DMA | 144.1 | | 100 day DMA | 137.58 | | 150 day DMA | 126.69 | | 200 day DMA | 120.16 | EMA (exponential moving average) of Netease Inc NTES
| EMA period | EMA current | EMA prev | EMA prev2 | | 5 day EMA | 149.91 | 148.44 | 148.55 | | 12 day EMA | 149.78 | 149.22 | 149.4 | | 20 day EMA | 149.38 | 149.02 | 149.11 | | 35 day EMA | 146.42 | 146.04 | 145.91 | | 50 day EMA | 143.45 | 143.07 | 142.86 |
SMA (simple moving average) of Netease Inc NTES
| SMA period | SMA current | SMA prev | SMA prev2 | | 5 day SMA | 148.81 | 148.12 | 147.86 | | 12 day SMA | 149.84 | 149.88 | 150.03 | | 20 day SMA | 150.32 | 150.29 | 150.48 | | 35 day SMA | 148.84 | 148.36 | 148.02 | | 50 day SMA | 144.1 | 143.62 | 143.22 | | 100 day SMA | 137.58 | 137.29 | 137.01 | | 150 day SMA | 126.69 | 126.35 | 126.05 | | 200 day SMA | 120.16 | 119.84 | 119.54 |
|
|
