BankN NTB full analysis,charts,indicators,moving averages,SMA,DMA,EMA,ADX,MACD,RSIBank N NTB WideScreen charts, DMA,SMA,EMA technical analysis, forecast prediction, by indicators ADX,MACD,RSI,CCI USA stock exchange
operates under Finance sector & deals in Commercial Banks
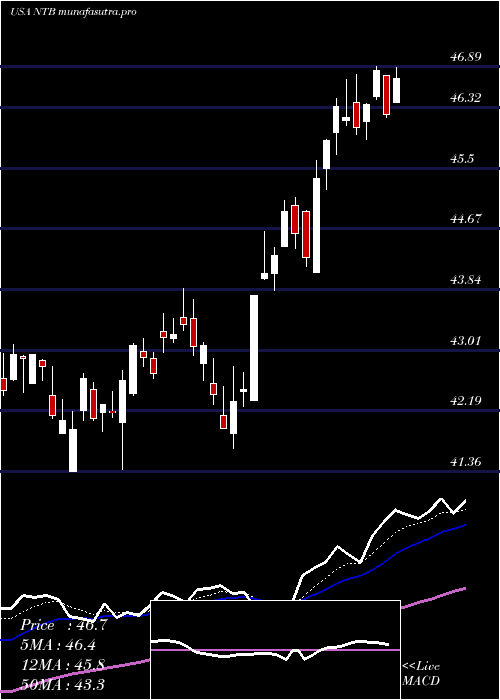
Daily price and charts and targets BankN Strong Daily Stock price targets for BankN NTB are 42.12 and 42.57 | Daily Target 1 | 41.78 | | Daily Target 2 | 42.01 | | Daily Target 3 | 42.23 | | Daily Target 4 | 42.46 | | Daily Target 5 | 42.68 |
Daily price and volume Bank N
| Date |
Closing |
Open |
Range |
Volume |
Wed 22 October 2025 |
42.24 (0.76%) |
42.04 |
42.00 - 42.45 |
0.7905 times |
Tue 21 October 2025 |
41.92 (-0.26%) |
42.01 |
41.89 - 42.37 |
0.8313 times |
Mon 20 October 2025 |
42.03 (1.33%) |
41.60 |
41.60 - 42.17 |
0.6765 times |
Fri 17 October 2025 |
41.48 (1.15%) |
41.33 |
40.59 - 41.81 |
1.0528 times |
Thu 16 October 2025 |
41.01 (-2.31%) |
41.86 |
40.79 - 42.03 |
1.0452 times |
Wed 15 October 2025 |
41.98 (-0.97%) |
42.36 |
41.77 - 42.60 |
0.9122 times |
Tue 14 October 2025 |
42.39 (1.58%) |
41.61 |
41.14 - 42.54 |
1.3661 times |
Mon 13 October 2025 |
41.73 (-0.83%) |
41.65 |
41.47 - 42.00 |
1.0229 times |
Tue 07 October 2025 |
42.08 (0.72%) |
41.78 |
41.78 - 42.30 |
1.4871 times |
Mon 06 October 2025 |
41.78 (-1.16%) |
42.39 |
41.42 - 42.91 |
0.8155 times |
Fri 03 October 2025 |
42.27 (0.31%) |
42.15 |
42.10 - 42.75 |
1.4138 times |
Weekly price and charts BankN Strong weekly Stock price targets for BankN NTB are 41.92 and 42.77 | Weekly Target 1 | 41.25 | | Weekly Target 2 | 41.74 | | Weekly Target 3 | 42.096666666667 | | Weekly Target 4 | 42.59 | | Weekly Target 5 | 42.95 |
Weekly price and volumes for Bank N
| Date |
Closing |
Open |
Range |
Volume |
Wed 22 October 2025 |
42.24 (1.83%) |
41.60 |
41.60 - 42.45 |
0.5797 times |
Fri 17 October 2025 |
41.48 (-1.43%) |
41.65 |
40.59 - 42.60 |
1.3618 times |
Tue 07 October 2025 |
42.08 (-0.45%) |
42.39 |
41.42 - 42.91 |
0.5808 times |
Fri 03 October 2025 |
42.27 (-4.28%) |
43.69 |
41.95 - 43.94 |
1.1171 times |
Fri 26 September 2025 |
44.16 (-1.47%) |
44.77 |
43.85 - 45.28 |
0.9362 times |
Fri 19 September 2025 |
44.82 (-0.97%) |
45.30 |
44.00 - 45.77 |
1.7327 times |
Fri 12 September 2025 |
45.26 (1.32%) |
44.85 |
44.17 - 45.67 |
0.8344 times |
Fri 05 September 2025 |
44.67 (-1%) |
43.13 |
42.98 - 46.00 |
1.0229 times |
Fri 29 August 2025 |
45.12 (0%) |
45.09 |
44.72 - 45.44 |
0.4177 times |
Fri 29 August 2025 |
45.12 (-0.9%) |
45.53 |
44.72 - 45.83 |
1.4166 times |
Fri 22 August 2025 |
45.53 (4.14%) |
43.68 |
43.61 - 45.73 |
1.0032 times |
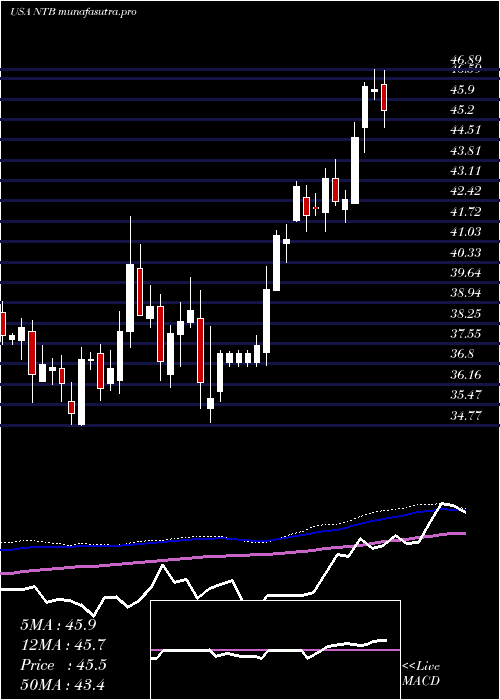
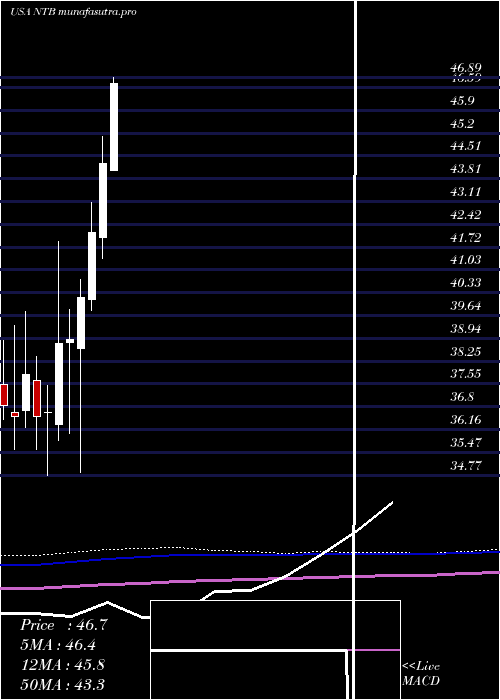
Monthly price and charts BankN Strong monthly Stock price targets for BankN NTB are 40.06 and 42.78 | Monthly Target 1 | 39.33 | | Monthly Target 2 | 40.78 | | Monthly Target 3 | 42.046666666667 | | Monthly Target 4 | 43.5 | | Monthly Target 5 | 44.77 |
Monthly price and volumes Bank N
| Date |
Closing |
Open |
Range |
Volume |
Wed 22 October 2025 |
42.24 (-1.58%) |
42.66 |
40.59 - 43.31 |
0.6632 times |
Tue 30 September 2025 |
42.92 (-4.88%) |
43.13 |
42.36 - 46.00 |
1.0199 times |
Fri 29 August 2025 |
45.12 (-0.86%) |
44.98 |
43.61 - 46.12 |
1.1781 times |
Thu 31 July 2025 |
45.51 (2.78%) |
44.07 |
44.05 - 46.89 |
0.9866 times |
Mon 30 June 2025 |
44.28 (5.03%) |
42.03 |
41.38 - 45.10 |
0.8981 times |
Fri 30 May 2025 |
42.16 (4.93%) |
40.11 |
39.80 - 43.09 |
0.9652 times |
Wed 30 April 2025 |
40.18 (3.24%) |
38.62 |
34.86 - 40.73 |
1.0803 times |
Mon 31 March 2025 |
38.92 (0.31%) |
38.83 |
36.04 - 39.81 |
1.0974 times |
Fri 28 February 2025 |
38.80 (5.75%) |
36.30 |
35.84 - 41.88 |
1.0324 times |
Fri 31 January 2025 |
36.69 (0.38%) |
36.67 |
34.77 - 37.51 |
1.0789 times |
Tue 31 December 2024 |
36.55 (-3.38%) |
37.65 |
35.54 - 38.40 |
0.9774 times |
DMA SMA EMA moving averages of Bank N NTB
DMA (daily moving average) of Bank N NTB
| DMA period | DMA value | | 5 day DMA | 41.74 | | 12 day DMA | 41.92 | | 20 day DMA | 42.67 | | 35 day DMA | 43.65 | | 50 day DMA | 44 | | 100 day DMA | 44.22 | | 150 day DMA | 42.56 | | 200 day DMA | 41.32 | EMA (exponential moving average) of Bank N NTB
| EMA period | EMA current | EMA prev | EMA prev2 | | 5 day EMA | 41.97 | 41.83 | 41.79 | | 12 day EMA | 42.17 | 42.16 | 42.2 | | 20 day EMA | 42.6 | 42.64 | 42.72 | | 35 day EMA | 43.19 | 43.25 | 43.33 | | 50 day EMA | 43.87 | 43.94 | 44.02 |
SMA (simple moving average) of Bank N NTB
| SMA period | SMA current | SMA prev | SMA prev2 | | 5 day SMA | 41.74 | 41.68 | 41.78 | | 12 day SMA | 41.92 | 41.95 | 42.03 | | 20 day SMA | 42.67 | 42.8 | 42.99 | | 35 day SMA | 43.65 | 43.73 | 43.82 | | 50 day SMA | 44 | 44.06 | 44.12 | | 100 day SMA | 44.22 | 44.21 | 44.22 | | 150 day SMA | 42.56 | 42.53 | 42.5 | | 200 day SMA | 41.32 | 41.29 | 41.27 |
|
|
