NapcoSecurity NSSC full analysis,charts,indicators,moving averages,SMA,DMA,EMA,ADX,MACD,RSINapco Security NSSC WideScreen charts, DMA,SMA,EMA technical analysis, forecast prediction, by indicators ADX,MACD,RSI,CCI USA stock exchange
operates under Consumer Durables sector & deals in Telecommunications Equipment
Daily price and charts and targets NapcoSecurity Strong Daily Stock price targets for NapcoSecurity NSSC are 40.61 and 41.88 | Daily Target 1 | 39.65 | | Daily Target 2 | 40.29 | | Daily Target 3 | 40.92 | | Daily Target 4 | 41.56 | | Daily Target 5 | 42.19 |
Daily price and volume Napco Security
| Date |
Closing |
Open |
Range |
Volume |
Thu 04 December 2025 |
40.93 (-0.22%) |
40.79 |
40.28 - 41.55 |
0.9219 times |
Wed 03 December 2025 |
41.02 (2.86%) |
39.91 |
38.97 - 41.08 |
0.9359 times |
Tue 02 December 2025 |
39.88 (5.47%) |
38.19 |
37.91 - 39.92 |
1.697 times |
Mon 01 December 2025 |
37.81 (-6.41%) |
39.91 |
37.64 - 39.91 |
1.4489 times |
Fri 28 November 2025 |
40.40 (-0.88%) |
41.06 |
39.99 - 41.06 |
0.2826 times |
Wed 26 November 2025 |
40.76 (0.54%) |
40.30 |
40.08 - 40.90 |
0.4047 times |
Tue 25 November 2025 |
40.54 (4.54%) |
38.99 |
38.99 - 40.59 |
0.6518 times |
Mon 24 November 2025 |
38.78 (0.54%) |
38.83 |
38.49 - 39.54 |
0.9677 times |
Fri 21 November 2025 |
38.57 (1.5%) |
37.98 |
37.86 - 39.08 |
1.3942 times |
Thu 20 November 2025 |
38.00 (-4.02%) |
40.60 |
37.85 - 40.95 |
1.2953 times |
Wed 19 November 2025 |
39.59 (0.74%) |
39.30 |
39.06 - 40.07 |
0.9115 times |
Weekly price and charts NapcoSecurity Strong weekly Stock price targets for NapcoSecurity NSSC are 39.29 and 43.2 | Weekly Target 1 | 36.13 | | Weekly Target 2 | 38.53 | | Weekly Target 3 | 40.04 | | Weekly Target 4 | 42.44 | | Weekly Target 5 | 43.95 |
Weekly price and volumes for Napco Security
| Date |
Closing |
Open |
Range |
Volume |
Thu 04 December 2025 |
40.93 (1.31%) |
39.91 |
37.64 - 41.55 |
1.5187 times |
Fri 28 November 2025 |
40.40 (4.74%) |
38.83 |
38.49 - 41.06 |
0.7002 times |
Fri 21 November 2025 |
38.57 (-4.41%) |
40.31 |
37.85 - 40.99 |
1.4102 times |
Fri 14 November 2025 |
40.35 (-4.25%) |
42.55 |
39.52 - 42.91 |
0.8218 times |
Fri 07 November 2025 |
42.14 (-4.55%) |
42.17 |
40.20 - 44.46 |
1.3451 times |
Fri 31 October 2025 |
44.15 (0%) |
43.80 |
43.51 - 44.25 |
0.2936 times |
Fri 31 October 2025 |
44.15 (0.14%) |
44.44 |
42.70 - 44.82 |
0.9366 times |
Fri 24 October 2025 |
44.09 (1.66%) |
43.59 |
42.68 - 45.14 |
0.9033 times |
Fri 17 October 2025 |
43.37 (3.41%) |
42.86 |
41.59 - 44.34 |
0.8627 times |
Fri 10 October 2025 |
41.94 (-1.64%) |
43.07 |
41.88 - 44.30 |
1.2078 times |
Fri 03 October 2025 |
42.64 (-1.16%) |
43.20 |
42.25 - 43.50 |
0.8414 times |
Monthly price and charts NapcoSecurity Strong monthly Stock price targets for NapcoSecurity NSSC are 39.29 and 43.2 | Monthly Target 1 | 36.13 | | Monthly Target 2 | 38.53 | | Monthly Target 3 | 40.04 | | Monthly Target 4 | 42.44 | | Monthly Target 5 | 43.95 |
Monthly price and volumes Napco Security
| Date |
Closing |
Open |
Range |
Volume |
Thu 04 December 2025 |
40.93 (1.31%) |
39.91 |
37.64 - 41.55 |
0.2797 times |
Fri 28 November 2025 |
40.40 (-8.49%) |
42.17 |
37.85 - 44.46 |
0.7879 times |
Fri 31 October 2025 |
44.15 (2.79%) |
42.46 |
41.59 - 45.14 |
0.862 times |
Tue 30 September 2025 |
42.95 (12.88%) |
37.84 |
37.52 - 45.03 |
1.3737 times |
Fri 29 August 2025 |
38.05 (24.63%) |
30.11 |
29.27 - 38.60 |
1.1267 times |
Thu 31 July 2025 |
30.53 (2.83%) |
29.50 |
29.22 - 32.06 |
0.7828 times |
Mon 30 June 2025 |
29.69 (6.42%) |
27.81 |
26.44 - 30.23 |
0.8609 times |
Fri 30 May 2025 |
27.90 (22.1%) |
22.90 |
22.73 - 28.59 |
1.4468 times |
Wed 30 April 2025 |
22.85 (-0.74%) |
23.40 |
19.00 - 23.60 |
1.3002 times |
Mon 31 March 2025 |
23.02 (-6.27%) |
24.65 |
22.36 - 25.77 |
1.1793 times |
Fri 28 February 2025 |
24.56 (-33.08%) |
29.30 |
23.84 - 30.00 |
2.1794 times |

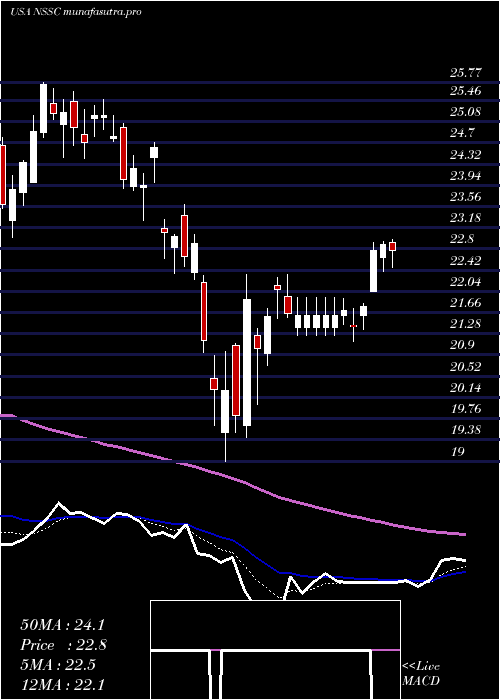
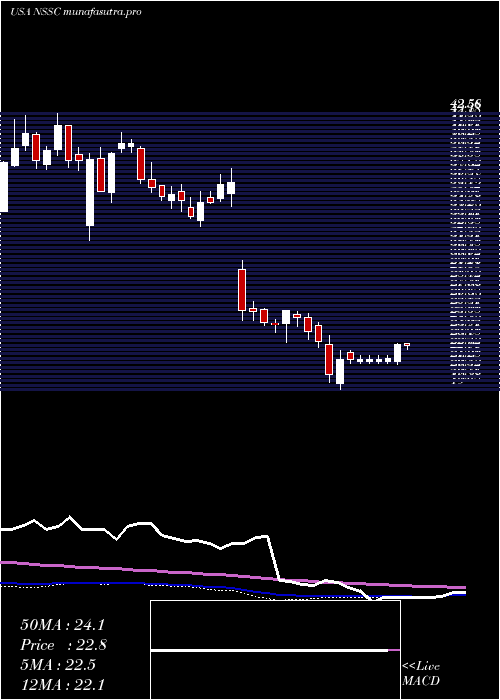
DMA SMA EMA moving averages of Napco Security NSSC
DMA (daily moving average) of Napco Security NSSC
| DMA period | DMA value | | 5 day DMA | 40.01 | | 12 day DMA | 39.63 | | 20 day DMA | 40.37 | | 35 day DMA | 41.79 | | 50 day DMA | 42.14 | | 100 day DMA | 38.59 | | 150 day DMA | 35.14 | | 200 day DMA | 32.16 | EMA (exponential moving average) of Napco Security NSSC
| EMA period | EMA current | EMA prev | EMA prev2 | | 5 day EMA | 40.32 | 40.01 | 39.51 | | 12 day EMA | 40.19 | 40.06 | 39.89 | | 20 day EMA | 40.56 | 40.52 | 40.47 | | 35 day EMA | 41.16 | 41.17 | 41.18 | | 50 day EMA | 41.98 | 42.02 | 42.06 |
SMA (simple moving average) of Napco Security NSSC
| SMA period | SMA current | SMA prev | SMA prev2 | | 5 day SMA | 40.01 | 39.97 | 39.88 | | 12 day SMA | 39.63 | 39.57 | 39.52 | | 20 day SMA | 40.37 | 40.54 | 40.56 | | 35 day SMA | 41.79 | 41.86 | 41.92 | | 50 day SMA | 42.14 | 42.19 | 42.23 | | 100 day SMA | 38.59 | 38.48 | 38.38 | | 150 day SMA | 35.14 | 35.02 | 34.9 | | 200 day SMA | 32.16 | 32.08 | 32 |
|
|
