InsperityInc NSP full analysis,charts,indicators,moving averages,SMA,DMA,EMA,ADX,MACD,RSIInsperity Inc NSP WideScreen charts, DMA,SMA,EMA technical analysis, forecast prediction, by indicators ADX,MACD,RSI,CCI USA stock exchange
operates under Technology sector & deals in Professional Services
Daily price and charts and targets InsperityInc Strong Daily Stock price targets for InsperityInc NSP are 35.28 and 36.13 | Daily Target 1 | 35.06 | | Daily Target 2 | 35.5 | | Daily Target 3 | 35.91 | | Daily Target 4 | 36.35 | | Daily Target 5 | 36.76 |
Daily price and volume Insperity Inc
| Date |
Closing |
Open |
Range |
Volume |
Thu 04 December 2025 |
35.94 (-0.08%) |
36.14 |
35.47 - 36.32 |
0.6718 times |
Wed 03 December 2025 |
35.97 (3.87%) |
34.70 |
34.43 - 35.99 |
1.3545 times |
Tue 02 December 2025 |
34.63 (-1.95%) |
35.50 |
34.27 - 35.50 |
0.5846 times |
Mon 01 December 2025 |
35.32 (-0.14%) |
35.20 |
35.04 - 35.98 |
0.822 times |
Fri 28 November 2025 |
35.37 (-0.23%) |
35.37 |
35.04 - 35.69 |
0.2659 times |
Wed 26 November 2025 |
35.45 (-0.25%) |
35.45 |
35.13 - 35.96 |
0.5679 times |
Tue 25 November 2025 |
35.54 (4.53%) |
33.88 |
33.85 - 35.82 |
0.8282 times |
Mon 24 November 2025 |
34.00 (-1.33%) |
34.11 |
33.07 - 34.18 |
0.8801 times |
Fri 21 November 2025 |
34.46 (6.19%) |
32.80 |
32.49 - 34.56 |
1.7716 times |
Thu 20 November 2025 |
32.45 (2.4%) |
31.71 |
31.24 - 32.52 |
2.2534 times |
Wed 19 November 2025 |
31.69 (-1.09%) |
32.04 |
31.19 - 32.04 |
0.5883 times |
Weekly price and charts InsperityInc Strong weekly Stock price targets for InsperityInc NSP are 35.11 and 37.16 | Weekly Target 1 | 33.46 | | Weekly Target 2 | 34.7 | | Weekly Target 3 | 35.51 | | Weekly Target 4 | 36.75 | | Weekly Target 5 | 37.56 |
Weekly price and volumes for Insperity Inc
| Date |
Closing |
Open |
Range |
Volume |
Thu 04 December 2025 |
35.94 (1.61%) |
35.20 |
34.27 - 36.32 |
0.9656 times |
Fri 28 November 2025 |
35.37 (2.64%) |
34.11 |
33.07 - 35.96 |
0.715 times |
Fri 21 November 2025 |
34.46 (5.51%) |
32.40 |
31.00 - 34.56 |
1.766 times |
Fri 14 November 2025 |
32.66 (-3.54%) |
34.16 |
32.47 - 35.12 |
1.1043 times |
Fri 07 November 2025 |
33.86 (-23.25%) |
35.72 |
33.00 - 40.17 |
1.9938 times |
Fri 31 October 2025 |
44.12 (0%) |
42.72 |
42.51 - 44.35 |
0.279 times |
Fri 31 October 2025 |
44.12 (-4.07%) |
46.28 |
42.11 - 46.68 |
0.9807 times |
Fri 24 October 2025 |
45.99 (-2.38%) |
47.21 |
45.49 - 48.50 |
0.6777 times |
Fri 17 October 2025 |
47.11 (2.86%) |
46.20 |
45.47 - 47.80 |
0.8557 times |
Fri 10 October 2025 |
45.80 (-7.17%) |
49.70 |
45.41 - 49.86 |
0.6622 times |
Fri 03 October 2025 |
49.34 (-0.2%) |
49.74 |
47.99 - 50.09 |
0.7278 times |
Monthly price and charts InsperityInc Strong monthly Stock price targets for InsperityInc NSP are 35.11 and 37.16 | Monthly Target 1 | 33.46 | | Monthly Target 2 | 34.7 | | Monthly Target 3 | 35.51 | | Monthly Target 4 | 36.75 | | Monthly Target 5 | 37.56 |
Monthly price and volumes Insperity Inc
| Date |
Closing |
Open |
Range |
Volume |
Thu 04 December 2025 |
35.94 (1.61%) |
35.20 |
34.27 - 36.32 |
0.2803 times |
Fri 28 November 2025 |
35.37 (-19.83%) |
35.72 |
31.00 - 40.17 |
1.6197 times |
Fri 31 October 2025 |
44.12 (-10.33%) |
48.75 |
42.11 - 50.09 |
1.1165 times |
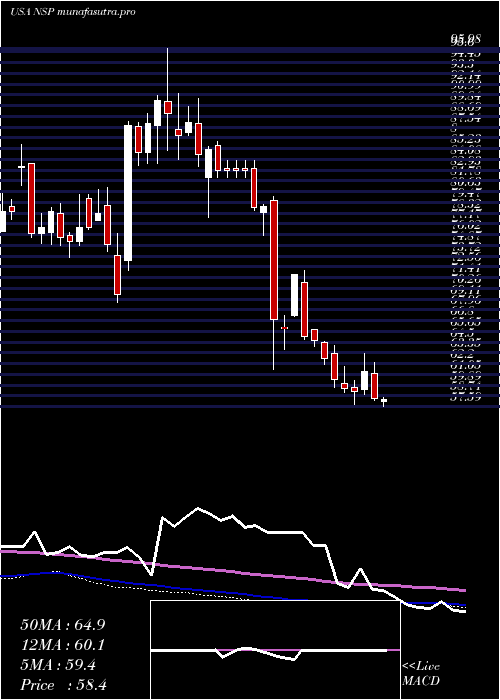
Tue 30 September 2025 |
49.20 (-10.9%) |
55.00 |
48.17 - 57.22 |
1.0834 times |
Fri 29 August 2025 |
55.22 (-7.32%) |
55.85 |
45.07 - 57.41 |
1.3757 times |
Thu 31 July 2025 |
59.58 (-0.9%) |
59.84 |
56.35 - 63.30 |
0.8057 times |
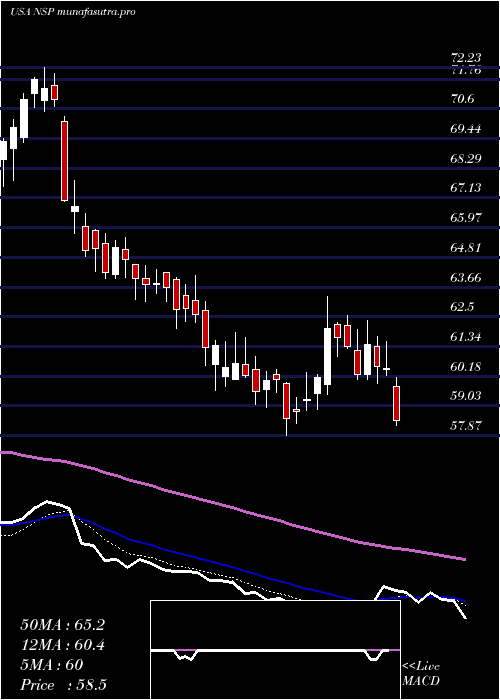
Mon 30 June 2025 |
60.12 (-7.11%) |
64.52 |
57.87 - 64.53 |
0.8307 times |
Fri 30 May 2025 |
64.72 (-0.45%) |
64.79 |
63.00 - 72.23 |
1.0524 times |
Wed 30 April 2025 |
65.01 (-27.14%) |
89.12 |
61.54 - 90.45 |
0.8615 times |
Mon 31 March 2025 |
89.23 (1.43%) |
87.75 |
83.68 - 95.98 |
0.974 times |
Fri 28 February 2025 |
87.97 (17.28%) |
73.75 |
68.79 - 89.04 |
0.8538 times |
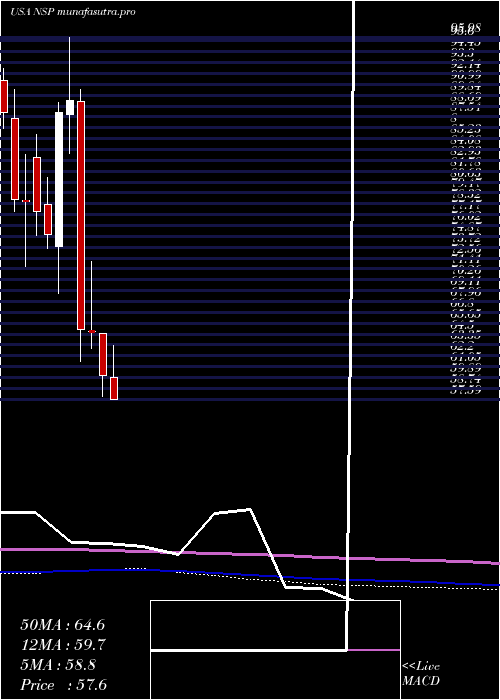
DMA SMA EMA moving averages of Insperity Inc NSP
DMA (daily moving average) of Insperity Inc NSP
| DMA period | DMA value | | 5 day DMA | 35.45 | | 12 day DMA | 34.41 | | 20 day DMA | 33.97 | | 35 day DMA | 38.49 | | 50 day DMA | 41.4 | | 100 day DMA | 47.82 | | 150 day DMA | 53.07 | | 200 day DMA | 60.99 | EMA (exponential moving average) of Insperity Inc NSP
| EMA period | EMA current | EMA prev | EMA prev2 | | 5 day EMA | 35.47 | 35.24 | 34.87 | | 12 day EMA | 35.1 | 34.95 | 34.77 | | 20 day EMA | 35.84 | 35.83 | 35.82 | | 35 day EMA | 38.32 | 38.46 | 38.61 | | 50 day EMA | 41.59 | 41.82 | 42.06 |
SMA (simple moving average) of Insperity Inc NSP
| SMA period | SMA current | SMA prev | SMA prev2 | | 5 day SMA | 35.45 | 35.35 | 35.26 | | 12 day SMA | 34.41 | 34.07 | 33.8 | | 20 day SMA | 33.97 | 33.98 | 34.03 | | 35 day SMA | 38.49 | 38.79 | 39.1 | | 50 day SMA | 41.4 | 41.7 | 41.99 | | 100 day SMA | 47.82 | 48.04 | 48.26 | | 150 day SMA | 53.07 | 53.26 | 53.47 | | 200 day SMA | 60.99 | 61.25 | 61.5 |
|
|
