InsightEnterprises NSIT full analysis,charts,indicators,moving averages,SMA,DMA,EMA,ADX,MACD,RSIInsight Enterprises NSIT WideScreen charts, DMA,SMA,EMA technical analysis, forecast prediction, by indicators ADX,MACD,RSI,CCI USA stock exchange
operates under Consumer Services sector & deals in Catalog Specialty Distribution
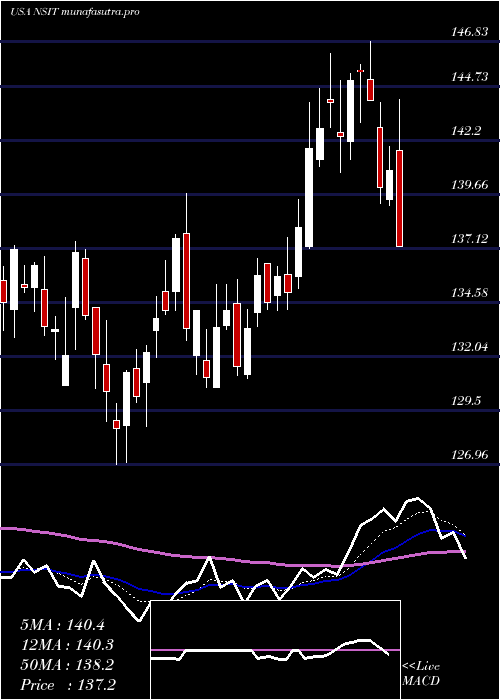
Daily price and charts and targets InsightEnterprises Strong Daily Stock price targets for InsightEnterprises NSIT are 84.44 and 87.54 | Daily Target 1 | 83.92 | | Daily Target 2 | 84.96 | | Daily Target 3 | 87.02 | | Daily Target 4 | 88.06 | | Daily Target 5 | 90.12 |
Daily price and volume Insight Enterprises
| Date |
Closing |
Open |
Range |
Volume |
Thu 04 December 2025 |
86.00 (-3.03%) |
88.74 |
85.98 - 89.08 |
0.6499 times |
Wed 03 December 2025 |
88.69 (-0.5%) |
89.35 |
88.51 - 90.21 |
0.5956 times |
Tue 02 December 2025 |
89.14 (2.96%) |
87.91 |
87.13 - 90.38 |
1.0384 times |
Mon 01 December 2025 |
86.58 (0.01%) |
85.64 |
85.50 - 88.19 |
0.986 times |
Fri 28 November 2025 |
86.57 (-0.23%) |
86.46 |
85.10 - 87.10 |
0.4259 times |
Wed 26 November 2025 |
86.77 (1.82%) |
85.60 |
85.17 - 87.32 |
1.3599 times |
Tue 25 November 2025 |
85.22 (1.68%) |
84.46 |
83.87 - 86.51 |
0.8761 times |
Mon 24 November 2025 |
83.81 (-0.29%) |
84.64 |
82.33 - 85.90 |
1.5605 times |
Fri 21 November 2025 |
84.05 (2.3%) |
82.04 |
82.04 - 85.05 |
1.8494 times |
Thu 20 November 2025 |
82.16 (-1.9%) |
84.97 |
81.59 - 85.89 |
0.6583 times |
Wed 19 November 2025 |
83.75 (-4.84%) |
87.47 |
83.43 - 88.53 |
1.5356 times |
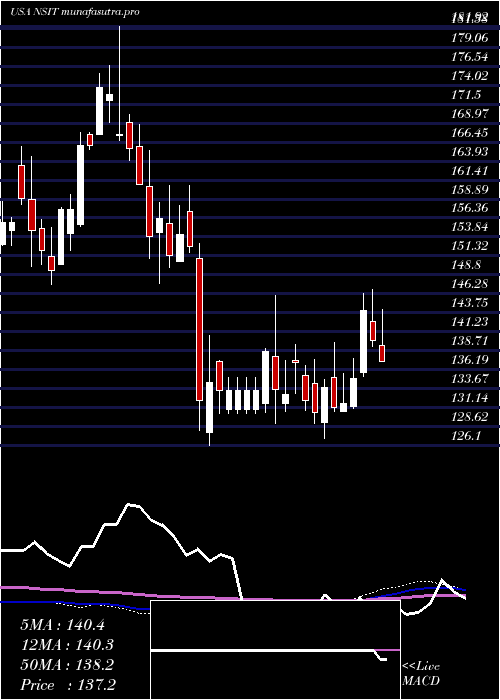
Weekly price and charts InsightEnterprises Strong weekly Stock price targets for InsightEnterprises NSIT are 85.75 and 90.63 | Weekly Target 1 | 82.41 | | Weekly Target 2 | 84.21 | | Weekly Target 3 | 87.293333333333 | | Weekly Target 4 | 89.09 | | Weekly Target 5 | 92.17 |
Weekly price and volumes for Insight Enterprises
| Date |
Closing |
Open |
Range |
Volume |
Thu 04 December 2025 |
86.00 (-0.66%) |
85.64 |
85.50 - 90.38 |
0.8038 times |
Fri 28 November 2025 |
86.57 (3%) |
84.64 |
82.33 - 87.32 |
1.038 times |
Fri 21 November 2025 |
84.05 (-6.67%) |
89.88 |
81.59 - 90.73 |
1.5057 times |
Fri 14 November 2025 |
90.06 (-1.26%) |
91.45 |
88.61 - 92.82 |
0.8507 times |
Fri 07 November 2025 |
91.21 (-8.79%) |
97.65 |
89.50 - 97.90 |
0.9221 times |
Fri 31 October 2025 |
100.00 (0%) |
99.65 |
97.97 - 100.95 |
0.4668 times |
Fri 31 October 2025 |
100.00 (-8.21%) |
109.10 |
97.30 - 109.46 |
1.6454 times |
Fri 24 October 2025 |
108.95 (0.78%) |
110.06 |
107.12 - 111.54 |
1.4042 times |
Fri 17 October 2025 |
108.11 (1.44%) |
107.52 |
105.82 - 110.81 |
0.599 times |
Fri 10 October 2025 |
106.58 (-4.39%) |
111.63 |
105.78 - 114.03 |
0.7644 times |
Fri 03 October 2025 |
111.47 (-1.15%) |
113.00 |
110.54 - 114.15 |
0.6947 times |
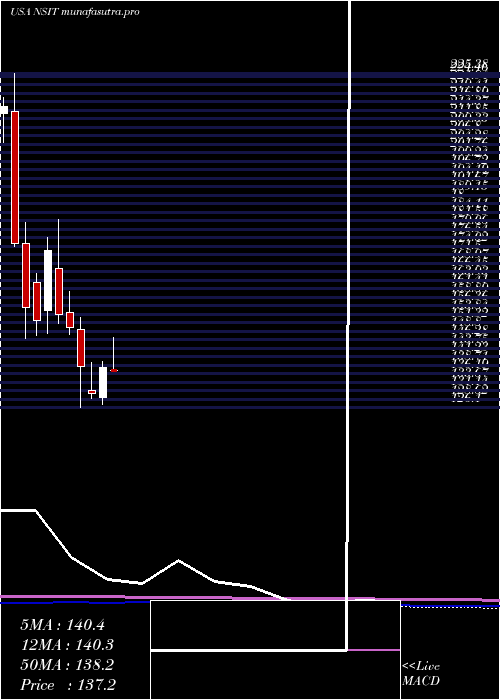
Monthly price and charts InsightEnterprises Strong monthly Stock price targets for InsightEnterprises NSIT are 85.75 and 90.63 | Monthly Target 1 | 82.41 | | Monthly Target 2 | 84.21 | | Monthly Target 3 | 87.293333333333 | | Monthly Target 4 | 89.09 | | Monthly Target 5 | 92.17 |
Monthly price and volumes Insight Enterprises
| Date |
Closing |
Open |
Range |
Volume |
Thu 04 December 2025 |
86.00 (-0.66%) |
85.64 |
85.50 - 90.38 |
0.2155 times |
Fri 28 November 2025 |
86.57 (-13.43%) |
97.65 |
81.59 - 97.90 |
1.1571 times |
Fri 31 October 2025 |
100.00 (-11.82%) |
113.17 |
97.30 - 114.15 |
1.4043 times |
Tue 30 September 2025 |
113.41 (-12.87%) |
128.85 |
111.10 - 130.53 |
1.1157 times |
Fri 29 August 2025 |
130.16 (9.77%) |
119.58 |
115.68 - 135.89 |
1.1358 times |
Thu 31 July 2025 |
118.58 (-14.13%) |
137.22 |
118.30 - 148.58 |
0.8482 times |
Mon 30 June 2025 |
138.09 (5.91%) |
129.05 |
126.96 - 139.72 |
0.7648 times |
Fri 30 May 2025 |
130.39 (-5.71%) |
131.36 |
129.00 - 139.56 |
1.1191 times |
Wed 30 April 2025 |
138.28 (-7.81%) |
149.27 |
126.10 - 152.98 |
1.0516 times |
Mon 31 March 2025 |
149.99 (-2.53%) |
154.43 |
147.69 - 160.72 |
1.188 times |
Fri 28 February 2025 |
153.88 (-10.92%) |
167.36 |
151.01 - 181.92 |
1.1132 times |
DMA SMA EMA moving averages of Insight Enterprises NSIT
DMA (daily moving average) of Insight Enterprises NSIT
| DMA period | DMA value | | 5 day DMA | 87.4 | | 12 day DMA | 85.9 | | 20 day DMA | 87.78 | | 35 day DMA | 94.93 | | 50 day DMA | 99.52 | | 100 day DMA | 114.41 | | 150 day DMA | 121.49 | | 200 day DMA | 127.61 | EMA (exponential moving average) of Insight Enterprises NSIT
| EMA period | EMA current | EMA prev | EMA prev2 | | 5 day EMA | 87.09 | 87.64 | 87.12 | | 12 day EMA | 87.46 | 87.73 | 87.55 | | 20 day EMA | 89.47 | 89.83 | 89.95 | | 35 day EMA | 94.17 | 94.65 | 95 | | 50 day EMA | 99.83 | 100.39 | 100.87 |
SMA (simple moving average) of Insight Enterprises NSIT
| SMA period | SMA current | SMA prev | SMA prev2 | | 5 day SMA | 87.4 | 87.55 | 86.86 | | 12 day SMA | 85.9 | 86.11 | 86.23 | | 20 day SMA | 87.78 | 88.22 | 88.54 | | 35 day SMA | 94.93 | 95.56 | 96.1 | | 50 day SMA | 99.52 | 100.08 | 100.65 | | 100 day SMA | 114.41 | 114.92 | 115.44 | | 150 day SMA | 121.49 | 121.84 | 122.18 | | 200 day SMA | 127.61 | 128.02 | 128.4 |
|
|
