NorfolkSouther NSC full analysis,charts,indicators,moving averages,SMA,DMA,EMA,ADX,MACD,RSINorfolk Souther NSC WideScreen charts, DMA,SMA,EMA technical analysis, forecast prediction, by indicators ADX,MACD,RSI,CCI USA stock exchange
operates under Transportation sector & deals in Railroads
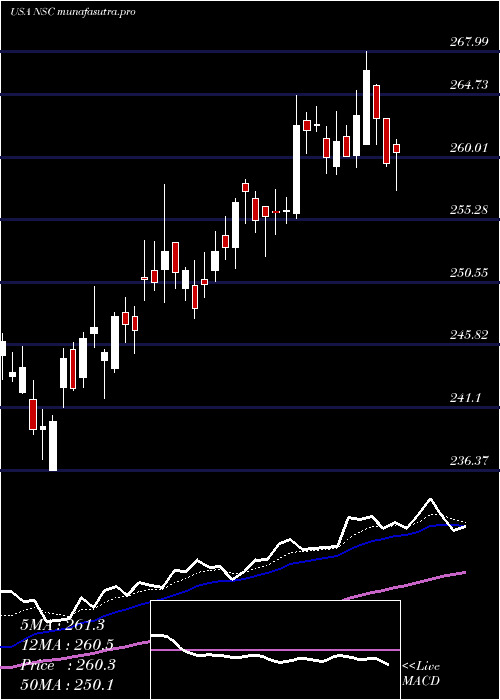
Daily price and charts and targets NorfolkSouther Strong Daily Stock price targets for NorfolkSouther NSC are 294.01 and 297.08 | Daily Target 1 | 291.59 | | Daily Target 2 | 293.36 | | Daily Target 3 | 294.66 | | Daily Target 4 | 296.43 | | Daily Target 5 | 297.73 |
Daily price and volume Norfolk Souther
| Date |
Closing |
Open |
Range |
Volume |
Thu 04 December 2025 |
295.13 (0.37%) |
293.21 |
292.89 - 295.96 |
1.0028 times |
Wed 03 December 2025 |
294.05 (0.79%) |
292.09 |
290.71 - 295.25 |
0.9547 times |
Tue 02 December 2025 |
291.75 (0.66%) |
289.82 |
287.42 - 292.53 |
1.5426 times |
Mon 01 December 2025 |
289.83 (-0.77%) |
291.36 |
289.77 - 294.00 |
1.0279 times |
Fri 28 November 2025 |
292.09 (0.71%) |
289.67 |
288.88 - 293.28 |
0.2927 times |
Wed 26 November 2025 |
290.03 (0.34%) |
289.06 |
288.77 - 291.57 |
0.614 times |
Tue 25 November 2025 |
289.06 (2.1%) |
285.14 |
285.01 - 289.67 |
0.6599 times |
Mon 24 November 2025 |
283.11 (-1.11%) |
286.53 |
282.30 - 287.08 |
1.3636 times |
Fri 21 November 2025 |
286.29 (2.17%) |
281.58 |
281.26 - 286.96 |
0.8633 times |
Thu 20 November 2025 |
280.22 (-0.55%) |
283.29 |
280.09 - 285.63 |
1.6785 times |
Wed 19 November 2025 |
281.77 (0.37%) |
281.40 |
280.47 - 283.00 |
0.9715 times |
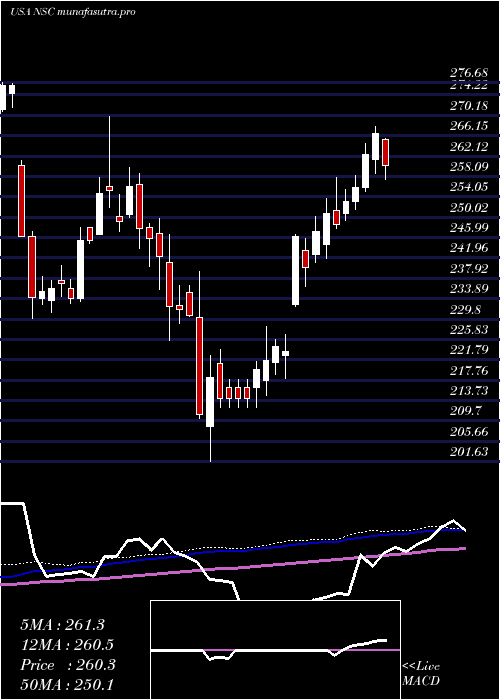
Weekly price and charts NorfolkSouther Strong weekly Stock price targets for NorfolkSouther NSC are 291.28 and 299.82 | Weekly Target 1 | 284.3 | | Weekly Target 2 | 289.71 | | Weekly Target 3 | 292.83666666667 | | Weekly Target 4 | 298.25 | | Weekly Target 5 | 301.38 |
Weekly price and volumes for Norfolk Souther
| Date |
Closing |
Open |
Range |
Volume |
Thu 04 December 2025 |
295.13 (1.04%) |
291.36 |
287.42 - 295.96 |
1.3641 times |
Fri 28 November 2025 |
292.09 (2.03%) |
286.53 |
282.30 - 293.28 |
0.8827 times |
Fri 21 November 2025 |
286.29 (0.81%) |
283.98 |
280.09 - 286.96 |
1.7672 times |
Fri 14 November 2025 |
283.98 (-0.09%) |
283.39 |
282.64 - 289.63 |
1.252 times |
Fri 07 November 2025 |
284.25 (0.31%) |
281.55 |
279.81 - 284.68 |
0.8705 times |
Fri 31 October 2025 |
283.38 (0%) |
280.41 |
279.50 - 284.53 |
0.2066 times |
Fri 31 October 2025 |
283.38 (1.03%) |
281.95 |
278.41 - 284.62 |
1.0791 times |
Fri 24 October 2025 |
280.50 (-3.2%) |
289.57 |
279.92 - 292.89 |
1.1986 times |
Fri 17 October 2025 |
289.78 (-2.06%) |
289.50 |
287.00 - 292.57 |
0.9427 times |
Tue 07 October 2025 |
295.86 (-1.35%) |
301.44 |
294.81 - 301.53 |
0.4365 times |
Fri 03 October 2025 |
299.91 (0.81%) |
297.23 |
297.20 - 302.24 |
1.1857 times |
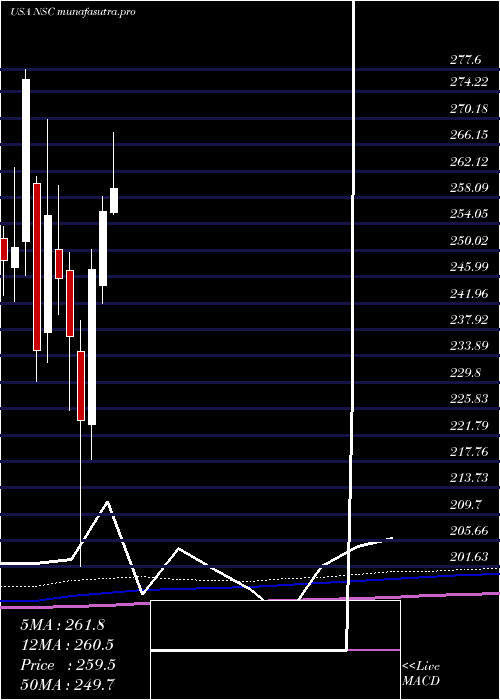
Monthly price and charts NorfolkSouther Strong monthly Stock price targets for NorfolkSouther NSC are 291.28 and 299.82 | Monthly Target 1 | 284.3 | | Monthly Target 2 | 289.71 | | Monthly Target 3 | 292.83666666667 | | Monthly Target 4 | 298.25 | | Monthly Target 5 | 301.38 |
Monthly price and volumes Norfolk Souther
| Date |
Closing |
Open |
Range |
Volume |
Thu 04 December 2025 |
295.13 (1.04%) |
291.36 |
287.42 - 295.96 |
0.2328 times |
Fri 28 November 2025 |
292.09 (3.07%) |
281.55 |
279.81 - 293.28 |
0.8146 times |
Fri 31 October 2025 |
283.38 (-5.67%) |
299.18 |
278.41 - 302.24 |
0.7886 times |
Tue 30 September 2025 |
300.41 (7.3%) |
277.97 |
268.23 - 300.91 |
1.2385 times |
Fri 29 August 2025 |
279.98 (0.71%) |
274.83 |
269.31 - 291.69 |
1.4514 times |
Thu 31 July 2025 |
278.00 (8.61%) |
255.78 |
255.41 - 288.11 |
2.0289 times |
Mon 30 June 2025 |
255.97 (3.58%) |
244.63 |
241.82 - 258.29 |
0.8101 times |
Fri 30 May 2025 |
247.12 (10.3%) |
223.41 |
218.05 - 250.23 |
0.893 times |
Wed 30 April 2025 |
224.05 (-5.4%) |
234.57 |
201.63 - 239.29 |
0.9461 times |
Mon 31 March 2025 |
236.85 (-3.62%) |
246.88 |
225.53 - 249.71 |
0.7959 times |
Fri 28 February 2025 |
245.75 (-3.74%) |
250.10 |
240.19 - 259.90 |
0.7278 times |
DMA SMA EMA moving averages of Norfolk Souther NSC
DMA (daily moving average) of Norfolk Souther NSC
| DMA period | DMA value | | 5 day DMA | 292.57 | | 12 day DMA | 287.84 | | 20 day DMA | 286.52 | | 35 day DMA | 285.63 | | 50 day DMA | 288.53 | | 100 day DMA | 283.09 | | 150 day DMA | 270.32 | | 200 day DMA | 260.48 | EMA (exponential moving average) of Norfolk Souther NSC
| EMA period | EMA current | EMA prev | EMA prev2 | | 5 day EMA | 292.56 | 291.28 | 289.9 | | 12 day EMA | 289.54 | 288.52 | 287.51 | | 20 day EMA | 288.03 | 287.28 | 286.57 | | 35 day EMA | 287.88 | 287.45 | 287.06 | | 50 day EMA | 288.24 | 287.96 | 287.71 |
SMA (simple moving average) of Norfolk Souther NSC
| SMA period | SMA current | SMA prev | SMA prev2 | | 5 day SMA | 292.57 | 291.55 | 290.55 | | 12 day SMA | 287.84 | 286.7 | 285.86 | | 20 day SMA | 286.52 | 285.8 | 285.29 | | 35 day SMA | 285.63 | 285.47 | 285.37 | | 50 day SMA | 288.53 | 288.3 | 288.07 | | 100 day SMA | 283.09 | 282.77 | 282.43 | | 150 day SMA | 270.32 | 269.83 | 269.38 | | 200 day SMA | 260.48 | 260.29 | 260.09 |
|
|
