NrgEnergy NRG full analysis,charts,indicators,moving averages,SMA,DMA,EMA,ADX,MACD,RSINrg Energy NRG WideScreen charts, DMA,SMA,EMA technical analysis, forecast prediction, by indicators ADX,MACD,RSI,CCI USA stock exchange
operates under Public Utilities sector & deals in Electric Utilities Central
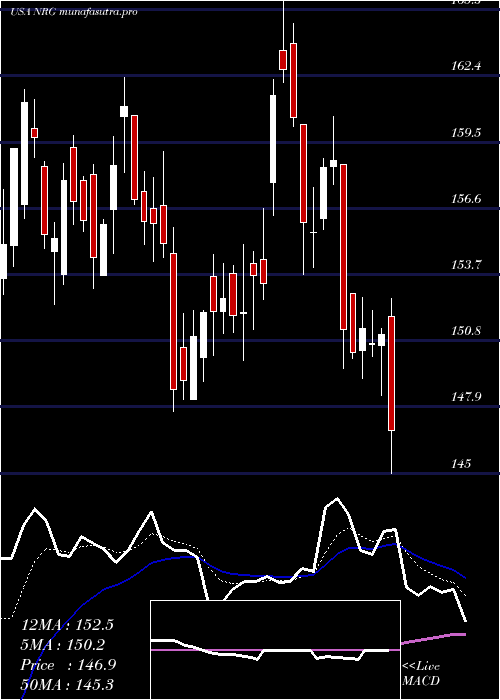
Daily price and charts and targets NrgEnergy Strong Daily Stock price targets for NrgEnergy NRG are 167.68 and 171.87 | Daily Target 1 | 164.33 | | Daily Target 2 | 166.84 | | Daily Target 3 | 168.51666666667 | | Daily Target 4 | 171.03 | | Daily Target 5 | 172.71 |
Daily price and volume Nrg Energy
| Date |
Closing |
Open |
Range |
Volume |
Thu 04 December 2025 |
169.36 (1.55%) |
166.14 |
166.00 - 170.19 |
0.853 times |
Wed 03 December 2025 |
166.77 (1.64%) |
163.76 |
160.22 - 167.00 |
0.8063 times |
Tue 02 December 2025 |
164.08 (-0.95%) |
166.94 |
162.76 - 168.08 |
0.9021 times |
Mon 01 December 2025 |
165.66 (-2.26%) |
167.55 |
163.76 - 167.57 |
0.7968 times |
Fri 28 November 2025 |
169.49 (0.56%) |
170.00 |
168.41 - 171.77 |
0.59 times |
Wed 26 November 2025 |
168.54 (2.89%) |
165.88 |
165.60 - 169.91 |
0.837 times |
Tue 25 November 2025 |
163.81 (-1.82%) |
167.19 |
161.00 - 168.32 |
1.017 times |
Mon 24 November 2025 |
166.85 (4.81%) |
160.34 |
158.95 - 167.97 |
1.581 times |
Fri 21 November 2025 |
159.20 (-0.79%) |
160.53 |
155.39 - 161.40 |
1.3234 times |
Thu 20 November 2025 |
160.46 (-4.94%) |
173.95 |
160.35 - 174.73 |
1.2935 times |
Wed 19 November 2025 |
168.80 (1.41%) |
166.29 |
166.26 - 173.52 |
1.4336 times |
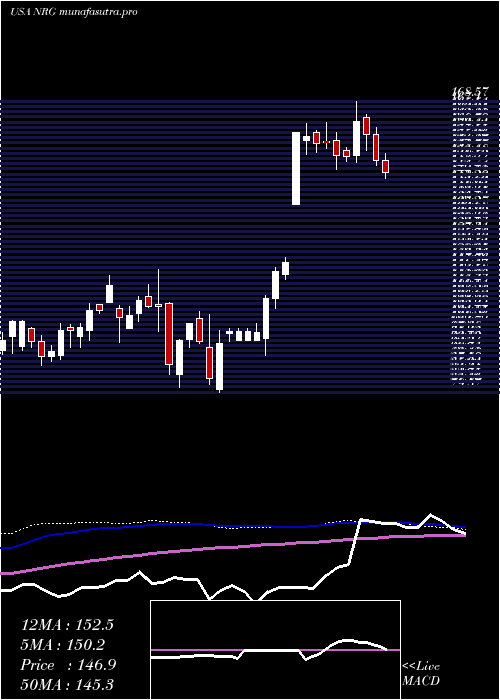
Weekly price and charts NrgEnergy Strong weekly Stock price targets for NrgEnergy NRG are 164.79 and 174.76 | Weekly Target 1 | 156.62 | | Weekly Target 2 | 162.99 | | Weekly Target 3 | 166.59 | | Weekly Target 4 | 172.96 | | Weekly Target 5 | 176.56 |
Weekly price and volumes for Nrg Energy
| Date |
Closing |
Open |
Range |
Volume |
Thu 04 December 2025 |
169.36 (-0.08%) |
167.55 |
160.22 - 170.19 |
0.6921 times |
Fri 28 November 2025 |
169.49 (6.46%) |
160.34 |
158.95 - 171.77 |
0.8295 times |
Fri 21 November 2025 |
159.20 (-3.63%) |
165.19 |
155.39 - 174.73 |
1.3423 times |
Fri 14 November 2025 |
165.19 (-4.24%) |
175.65 |
160.06 - 176.73 |
1.4286 times |
Fri 07 November 2025 |
172.50 (0.37%) |
171.66 |
162.00 - 177.09 |
1.2229 times |
Fri 31 October 2025 |
171.86 (0%) |
175.29 |
170.36 - 176.98 |
0.2018 times |
Fri 31 October 2025 |
171.86 (0.88%) |
172.28 |
165.84 - 180.54 |
1.2733 times |
Fri 24 October 2025 |
170.36 (0.96%) |
171.81 |
158.31 - 172.90 |
1.1665 times |
Fri 17 October 2025 |
168.74 (3.77%) |
164.19 |
163.09 - 173.99 |
1.2908 times |
Tue 07 October 2025 |
162.61 (-2.21%) |
168.26 |
162.07 - 169.97 |
0.5523 times |
Fri 03 October 2025 |
166.28 (-1.36%) |
169.31 |
160.57 - 172.21 |
1.5952 times |
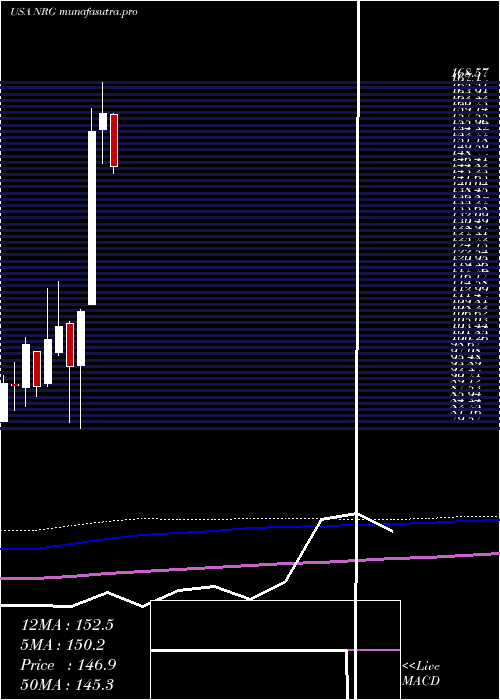
Monthly price and charts NrgEnergy Strong monthly Stock price targets for NrgEnergy NRG are 164.79 and 174.76 | Monthly Target 1 | 156.62 | | Monthly Target 2 | 162.99 | | Monthly Target 3 | 166.59 | | Monthly Target 4 | 172.96 | | Monthly Target 5 | 176.56 |
Monthly price and volumes Nrg Energy
| Date |
Closing |
Open |
Range |
Volume |
Thu 04 December 2025 |
169.36 (-0.08%) |
167.55 |
160.22 - 170.19 |
0.1032 times |
Fri 28 November 2025 |
169.49 (-1.38%) |
171.66 |
155.39 - 177.09 |
0.7189 times |
Fri 31 October 2025 |
171.86 (6.12%) |
161.68 |
158.31 - 180.54 |
0.8078 times |
Tue 30 September 2025 |
161.95 (11.26%) |
142.27 |
140.77 - 172.04 |
0.9599 times |
Fri 29 August 2025 |
145.56 (-12.94%) |
162.17 |
143.55 - 175.96 |
1.1168 times |
Thu 31 July 2025 |
167.20 (4.12%) |
160.26 |
143.40 - 169.24 |
1.1377 times |
Mon 30 June 2025 |
160.58 (3%) |
156.54 |
147.69 - 168.57 |
1.2666 times |
Fri 30 May 2025 |
155.90 (42.27%) |
111.29 |
111.25 - 161.78 |
1.5614 times |
Wed 30 April 2025 |
109.58 (14.79%) |
95.60 |
79.57 - 110.10 |
1.0235 times |
Mon 31 March 2025 |
95.46 (-9.7%) |
106.60 |
80.90 - 106.98 |
1.3043 times |
Fri 28 February 2025 |
105.71 (3.19%) |
99.00 |
98.27 - 117.26 |
1.0016 times |
DMA SMA EMA moving averages of Nrg Energy NRG
DMA (daily moving average) of Nrg Energy NRG
| DMA period | DMA value | | 5 day DMA | 167.07 | | 12 day DMA | 165.79 | | 20 day DMA | 166.25 | | 35 day DMA | 167.74 | | 50 day DMA | 167.23 | | 100 day DMA | 160.6 | | 150 day DMA | 156.17 | | 200 day DMA | 141.73 | EMA (exponential moving average) of Nrg Energy NRG
| EMA period | EMA current | EMA prev | EMA prev2 | | 5 day EMA | 167.15 | 166.04 | 165.67 | | 12 day EMA | 166.54 | 166.03 | 165.9 | | 20 day EMA | 166.66 | 166.38 | 166.34 | | 35 day EMA | 166.57 | 166.41 | 166.39 | | 50 day EMA | 167 | 166.9 | 166.91 |
SMA (simple moving average) of Nrg Energy NRG
| SMA period | SMA current | SMA prev | SMA prev2 | | 5 day SMA | 167.07 | 166.91 | 166.32 | | 12 day SMA | 165.79 | 165.28 | 165.15 | | 20 day SMA | 166.25 | 166.44 | 166.5 | | 35 day SMA | 167.74 | 167.79 | 167.76 | | 50 day SMA | 167.23 | 167.13 | 167.07 | | 100 day SMA | 160.6 | 160.42 | 160.25 | | 150 day SMA | 156.17 | 155.76 | 155.35 | | 200 day SMA | 141.73 | 141.4 | 141.09 |
|
|
