NationalResearch NRC full analysis,charts,indicators,moving averages,SMA,DMA,EMA,ADX,MACD,RSINational Research NRC WideScreen charts, DMA,SMA,EMA technical analysis, forecast prediction, by indicators ADX,MACD,RSI,CCI USA stock exchange
operates under Health Care sector & deals in Biotechnology Commercial Physical Biological Resarch
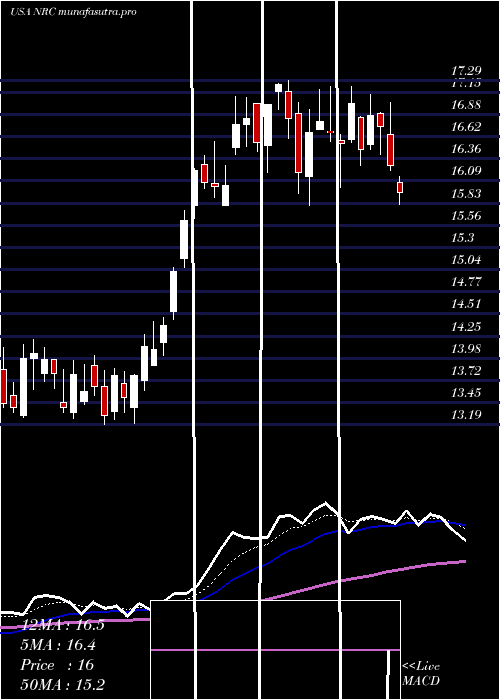
Daily price and charts and targets NationalResearch Strong Daily Stock price targets for NationalResearch NRC are 16.18 and 16.68 | Daily Target 1 | 15.79 | | Daily Target 2 | 16.06 | | Daily Target 3 | 16.293333333333 | | Daily Target 4 | 16.56 | | Daily Target 5 | 16.79 |
Daily price and volume National Research
| Date |
Closing |
Open |
Range |
Volume |
Thu 04 December 2025 |
16.32 (0.93%) |
16.16 |
16.03 - 16.53 |
0.5688 times |
Wed 03 December 2025 |
16.17 (-0.19%) |
16.30 |
16.06 - 16.43 |
0.7714 times |
Tue 02 December 2025 |
16.20 (-3.51%) |
16.79 |
16.15 - 16.79 |
0.9269 times |
Mon 01 December 2025 |
16.79 (-1.18%) |
16.99 |
16.50 - 17.06 |
0.9994 times |
Fri 28 November 2025 |
16.99 (-1.62%) |
17.25 |
16.76 - 17.25 |
0.6218 times |
Wed 26 November 2025 |
17.27 (-4.16%) |
17.89 |
17.17 - 17.97 |
0.7438 times |
Tue 25 November 2025 |
18.02 (4.04%) |
17.45 |
17.38 - 18.27 |
0.9568 times |
Mon 24 November 2025 |
17.32 (-1.93%) |
17.63 |
17.00 - 17.98 |
1.5383 times |
Fri 21 November 2025 |
17.66 (6.32%) |
16.52 |
16.36 - 17.90 |
1.6856 times |
Thu 20 November 2025 |
16.61 (1.84%) |
16.47 |
15.90 - 16.95 |
1.1871 times |
Wed 19 November 2025 |
16.31 (1.62%) |
16.04 |
15.92 - 16.38 |
0.6736 times |
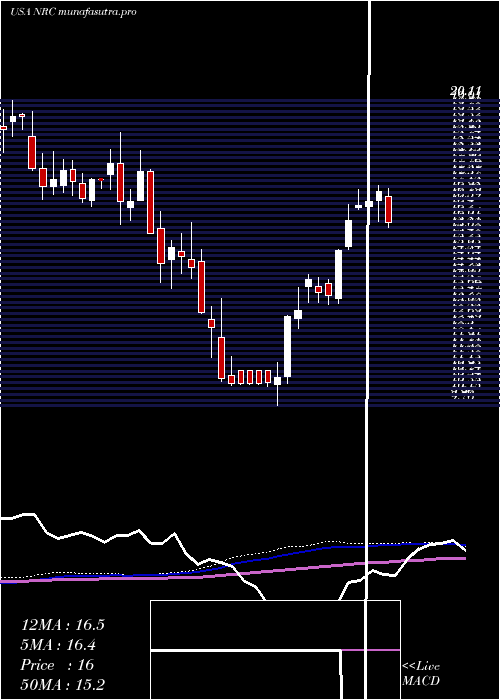
Weekly price and charts NationalResearch Strong weekly Stock price targets for NationalResearch NRC are 15.66 and 16.69 | Weekly Target 1 | 15.44 | | Weekly Target 2 | 15.88 | | Weekly Target 3 | 16.47 | | Weekly Target 4 | 16.91 | | Weekly Target 5 | 17.5 |
Weekly price and volumes for National Research
| Date |
Closing |
Open |
Range |
Volume |
Thu 04 December 2025 |
16.32 (-3.94%) |
16.99 |
16.03 - 17.06 |
0.6661 times |
Fri 28 November 2025 |
16.99 (-3.79%) |
17.63 |
16.76 - 18.27 |
0.7873 times |
Fri 21 November 2025 |
17.66 (15.96%) |
15.21 |
14.90 - 17.90 |
1.1449 times |
Fri 14 November 2025 |
15.23 (3.61%) |
14.89 |
13.86 - 15.75 |
1.2235 times |
Fri 07 November 2025 |
14.70 (10.03%) |
13.17 |
13.14 - 14.78 |
1.0625 times |
Fri 31 October 2025 |
13.36 (0%) |
13.06 |
12.62 - 13.38 |
0.2526 times |
Fri 31 October 2025 |
13.36 (14.58%) |
11.77 |
11.32 - 14.00 |
1.6995 times |
Fri 24 October 2025 |
11.66 (0.43%) |
11.70 |
11.51 - 12.16 |
0.888 times |
Fri 17 October 2025 |
11.61 (1.13%) |
11.67 |
11.01 - 11.88 |
1.1237 times |
Fri 10 October 2025 |
11.48 (-5.98%) |
12.25 |
11.28 - 12.30 |
1.1519 times |
Fri 03 October 2025 |
12.21 (-8.2%) |
13.36 |
12.10 - 13.36 |
0.9822 times |
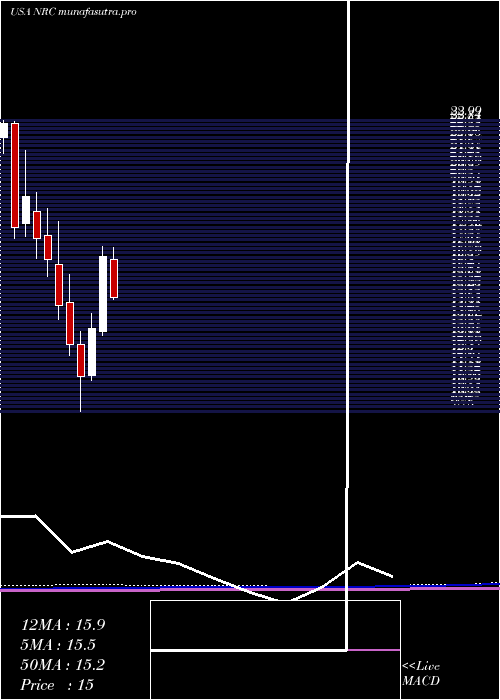
Monthly price and charts NationalResearch Strong monthly Stock price targets for NationalResearch NRC are 15.66 and 16.69 | Monthly Target 1 | 15.44 | | Monthly Target 2 | 15.88 | | Monthly Target 3 | 16.47 | | Monthly Target 4 | 16.91 | | Monthly Target 5 | 17.5 |
Monthly price and volumes National Research
| Date |
Closing |
Open |
Range |
Volume |
Thu 04 December 2025 |
16.32 (-3.94%) |
16.99 |
16.03 - 17.06 |
0.1556 times |
Fri 28 November 2025 |
16.99 (27.17%) |
13.17 |
13.14 - 18.27 |
0.9855 times |
Fri 31 October 2025 |
13.36 (4.54%) |
12.84 |
11.01 - 14.00 |
1.2968 times |
Tue 30 September 2025 |
12.78 (-13%) |
14.55 |
12.59 - 16.46 |
1.1837 times |
Fri 29 August 2025 |
14.69 (17.52%) |
12.32 |
12.29 - 16.21 |
1.1803 times |
Thu 31 July 2025 |
12.50 (-25.6%) |
16.68 |
12.32 - 17.22 |
1.0668 times |
Mon 30 June 2025 |
16.80 (24.35%) |
13.39 |
13.21 - 17.29 |
1.1015 times |
Fri 30 May 2025 |
13.51 (18.93%) |
11.41 |
11.15 - 14.20 |
1.1105 times |
Wed 30 April 2025 |
11.36 (-11.25%) |
12.79 |
9.76 - 13.38 |
1.0469 times |
Mon 31 March 2025 |
12.80 (-12.27%) |
14.71 |
12.32 - 15.98 |
0.8724 times |
Fri 28 February 2025 |
14.59 (-12.48%) |
16.47 |
13.93 - 18.41 |
1.0344 times |
DMA SMA EMA moving averages of National Research NRC
DMA (daily moving average) of National Research NRC
| DMA period | DMA value | | 5 day DMA | 16.49 | | 12 day DMA | 16.81 | | 20 day DMA | 16.12 | | 35 day DMA | 14.59 | | 50 day DMA | 13.88 | | 100 day DMA | 14.39 | | 150 day DMA | 14.57 | | 200 day DMA | 14.21 | EMA (exponential moving average) of National Research NRC
| EMA period | EMA current | EMA prev | EMA prev2 | | 5 day EMA | 16.48 | 16.56 | 16.76 | | 12 day EMA | 16.43 | 16.45 | 16.5 | | 20 day EMA | 15.98 | 15.94 | 15.92 | | 35 day EMA | 15.21 | 15.14 | 15.08 | | 50 day EMA | 14.24 | 14.15 | 14.07 |
SMA (simple moving average) of National Research NRC
| SMA period | SMA current | SMA prev | SMA prev2 | | 5 day SMA | 16.49 | 16.68 | 17.05 | | 12 day SMA | 16.81 | 16.78 | 16.71 | | 20 day SMA | 16.12 | 16.01 | 15.89 | | 35 day SMA | 14.59 | 14.45 | 14.32 | | 50 day SMA | 13.88 | 13.85 | 13.82 | | 100 day SMA | 14.39 | 14.38 | 14.37 | | 150 day SMA | 14.57 | 14.54 | 14.51 | | 200 day SMA | 14.21 | 14.21 | 14.22 |
|
|
