NeenahInc NP full analysis,charts,indicators,moving averages,SMA,DMA,EMA,ADX,MACD,RSINeenah Inc NP WideScreen charts, DMA,SMA,EMA technical analysis, forecast prediction, by indicators ADX,MACD,RSI,CCI USA stock exchange
operates under Basic Industries sector & deals in Paper
Daily price and charts and targets NeenahInc Strong Daily Stock price targets for NeenahInc NP are 24 and 25.26 | Daily Target 1 | 23.66 | | Daily Target 2 | 24.33 | | Daily Target 3 | 24.92 | | Daily Target 4 | 25.59 | | Daily Target 5 | 26.18 |
Daily price and volume Neenah Inc
| Date |
Closing |
Open |
Range |
Volume |
Mon 20 October 2025 |
25.00 (-0.52%) |
25.51 |
24.25 - 25.51 |
0.2657 times |
Fri 17 October 2025 |
25.13 (-2.48%) |
25.15 |
24.67 - 26.00 |
0.3882 times |
Thu 16 October 2025 |
25.77 (-2.35%) |
26.02 |
24.43 - 26.70 |
0.3057 times |
Wed 15 October 2025 |
26.39 (-3.47%) |
27.73 |
25.27 - 27.73 |
0.6328 times |
Tue 14 October 2025 |
27.34 (-3.63%) |
28.54 |
27.04 - 28.54 |
0.3319 times |
Mon 13 October 2025 |
28.37 (7.14%) |
25.99 |
25.90 - 28.90 |
0.8569 times |
Fri 10 October 2025 |
26.48 (-3.5%) |
27.85 |
26.28 - 27.85 |
0.7627 times |
Thu 09 October 2025 |
27.44 (1.25%) |
26.68 |
26.00 - 27.61 |
0.6543 times |
Wed 08 October 2025 |
27.10 (-1.02%) |
26.38 |
26.19 - 27.80 |
0.7381 times |
Tue 07 October 2025 |
27.38 (-8.7%) |
30.76 |
26.72 - 30.76 |
5.0637 times |
Mon 06 October 2025 |
29.99 (-1.35%) |
30.77 |
29.20 - 31.75 |
1.105 times |
Weekly price and charts NeenahInc Strong weekly Stock price targets for NeenahInc NP are 24 and 25.26 | Weekly Target 1 | 23.66 | | Weekly Target 2 | 24.33 | | Weekly Target 3 | 24.92 | | Weekly Target 4 | 25.59 | | Weekly Target 5 | 26.18 |
Weekly price and volumes for Neenah Inc
| Date |
Closing |
Open |
Range |
Volume |
Mon 20 October 2025 |
25.00 (-0.52%) |
25.51 |
24.25 - 25.51 |
0.0511 times |
Fri 17 October 2025 |
25.13 (-5.1%) |
25.99 |
24.43 - 28.90 |
0.4842 times |
Fri 10 October 2025 |
26.48 (-12.89%) |
30.77 |
26.00 - 31.75 |
1.6023 times |
Fri 03 October 2025 |
30.40 (-9.17%) |
33.26 |
22.30 - 33.26 |
6.3085 times |
Fri 01 July 2022 |
33.47 (0%) |
33.83 |
33.47 - 34.49 |
0.5011 times |
Fri 01 July 2022 |
33.47 (-0.03%) |
33.70 |
33.18 - 34.99 |
0.6192 times |
Fri 24 June 2022 |
33.48 (1.7%) |
32.92 |
31.41 - 33.96 |
0.1982 times |
Fri 17 June 2022 |
32.92 (0%) |
34.22 |
32.73 - 34.39 |
0.033 times |
Fri 17 June 2022 |
32.92 (-13.44%) |
37.22 |
32.73 - 37.61 |
0.1097 times |
Fri 10 June 2022 |
38.03 (-0.26%) |
38.48 |
37.44 - 39.51 |
0.0927 times |
Fri 03 June 2022 |
38.13 (-2%) |
38.64 |
36.94 - 39.41 |
0.0819 times |

Monthly price and charts NeenahInc Strong monthly Stock price targets for NeenahInc NP are 23.65 and 34.58 | Monthly Target 1 | 15.91 | | Monthly Target 2 | 20.46 | | Monthly Target 3 | 26.843333333333 | | Monthly Target 4 | 31.39 | | Monthly Target 5 | 37.77 |
Monthly price and volumes Neenah Inc
| Date |
Closing |
Open |
Range |
Volume |
Mon 20 October 2025 |
25.00 (-21.88%) |
22.50 |
22.30 - 33.23 |
5.6422 times |
Tue 05 July 2022 |
32.00 (-6.27%) |
33.83 |
31.05 - 34.49 |
0.8052 times |
Thu 30 June 2022 |
34.14 (-9.94%) |
37.71 |
31.41 - 39.51 |
0.416 times |
Tue 31 May 2022 |
37.91 (7.09%) |
35.69 |
35.01 - 40.29 |
0.4029 times |
Fri 29 April 2022 |
35.40 (-10.74%) |
40.18 |
35.19 - 42.69 |
0.5042 times |
Thu 31 March 2022 |
39.66 (1.82%) |
38.56 |
31.46 - 41.26 |
0.7014 times |
Mon 28 February 2022 |
38.95 (-15.51%) |
46.43 |
36.53 - 48.91 |
0.3887 times |
Mon 31 January 2022 |
46.10 (-0.39%) |
46.30 |
44.37 - 49.84 |
0.256 times |
Fri 31 December 2021 |
46.28 (-0.45%) |
47.36 |
42.82 - 49.15 |
0.3533 times |
Tue 30 November 2021 |
46.49 (-8.01%) |
50.87 |
46.12 - 56.86 |
0.53 times |
Fri 29 October 2021 |
50.54 (8.43%) |
46.77 |
46.31 - 51.91 |
0.2652 times |

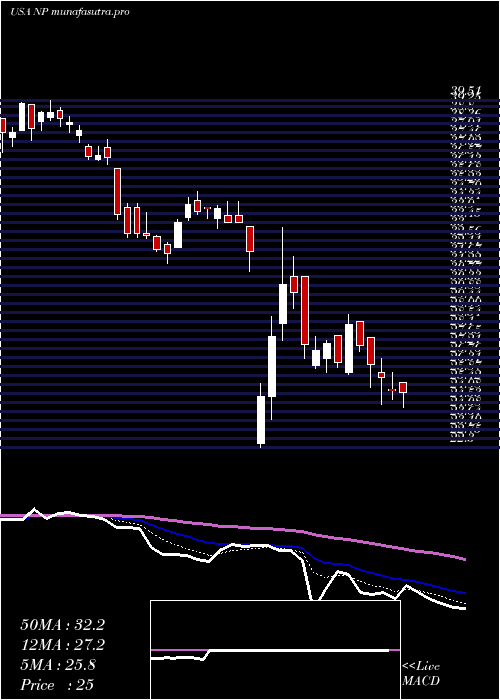
DMA SMA EMA moving averages of Neenah Inc NP
DMA (daily moving average) of Neenah Inc NP
| DMA period | DMA value | | 5 day DMA | 25.93 | | 12 day DMA | 27.23 | | 20 day DMA | 29.03 | | 35 day DMA | 31.69 | | 50 day DMA | 33.64 | | 100 day DMA | 35.78 | | 150 day DMA | 38.99 | | 200 day DMA | 41.65 | EMA (exponential moving average) of Neenah Inc NP
| EMA period | EMA current | EMA prev | EMA prev2 | | 5 day EMA | 25.81 | 26.21 | 26.75 | | 12 day EMA | 27.18 | 27.58 | 28.02 | | 20 day EMA | 28.64 | 29.02 | 29.43 | | 35 day EMA | 30.98 | 31.33 | 31.69 | | 50 day EMA | 33.28 | 33.62 | 33.97 |
SMA (simple moving average) of Neenah Inc NP
| SMA period | SMA current | SMA prev | SMA prev2 | | 5 day SMA | 25.93 | 26.6 | 26.87 | | 12 day SMA | 27.23 | 27.47 | 27.44 | | 20 day SMA | 29.03 | 29.5 | 29.92 | | 35 day SMA | 31.69 | 32.09 | 32.46 | | 50 day SMA | 33.64 | 33.92 | 34.2 | | 100 day SMA | 35.78 | 35.89 | 35.99 | | 150 day SMA | 38.99 | 39.12 | 39.25 | | 200 day SMA | 41.65 | 41.77 | 41.9 |
|
|
