ServicenowInc NOW full analysis,charts,indicators,moving averages,SMA,DMA,EMA,ADX,MACD,RSIServicenow Inc NOW WideScreen charts, DMA,SMA,EMA technical analysis, forecast prediction, by indicators ADX,MACD,RSI,CCI USA stock exchange
operates under Technology sector & deals in Computer Software Prepackaged Software
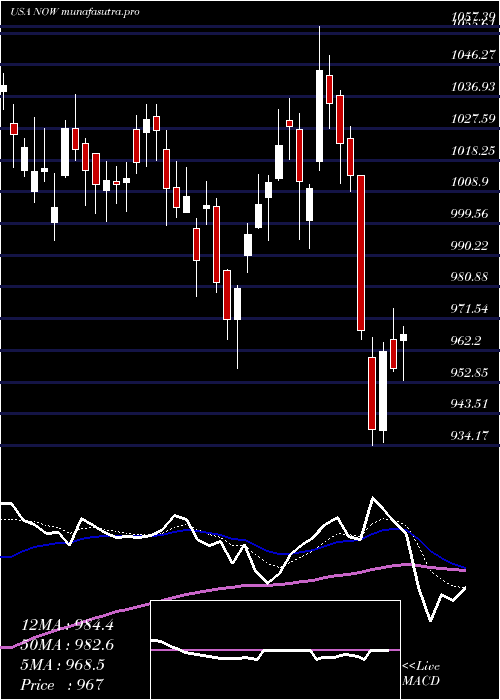
Daily price and charts and targets ServicenowInc Strong Daily Stock price targets for ServicenowInc NOW are 846.13 and 869.62 | Daily Target 1 | 827.76 | | Daily Target 2 | 841.01 | | Daily Target 3 | 851.25333333333 | | Daily Target 4 | 864.5 | | Daily Target 5 | 874.74 |
Daily price and volume Servicenow Inc
| Date |
Closing |
Open |
Range |
Volume |
Fri 05 December 2025 |
854.25 (1.83%) |
841.09 |
838.01 - 861.50 |
0.5431 times |
Thu 04 December 2025 |
838.87 (0.72%) |
841.00 |
830.69 - 846.50 |
1.0035 times |
Wed 03 December 2025 |
832.90 (1.03%) |
822.00 |
813.46 - 832.98 |
0.8353 times |
Tue 02 December 2025 |
824.38 (0.28%) |
828.62 |
824.00 - 833.43 |
1.1845 times |
Mon 01 December 2025 |
822.07 (1.19%) |
801.67 |
799.00 - 826.07 |
1.2537 times |
Fri 28 November 2025 |
812.41 (1.21%) |
808.00 |
805.01 - 814.00 |
0.8173 times |
Wed 26 November 2025 |
802.72 (-2.69%) |
817.25 |
799.84 - 822.02 |
1.8143 times |
Tue 25 November 2025 |
824.89 (1.19%) |
812.00 |
809.92 - 830.90 |
0.6412 times |
Mon 24 November 2025 |
815.22 (0.22%) |
816.80 |
803.81 - 819.49 |
0.5774 times |
Fri 21 November 2025 |
813.43 (1.62%) |
802.30 |
795.00 - 819.61 |
1.3296 times |
Thu 20 November 2025 |
800.46 (-1.96%) |
830.50 |
797.28 - 831.69 |
1.4638 times |
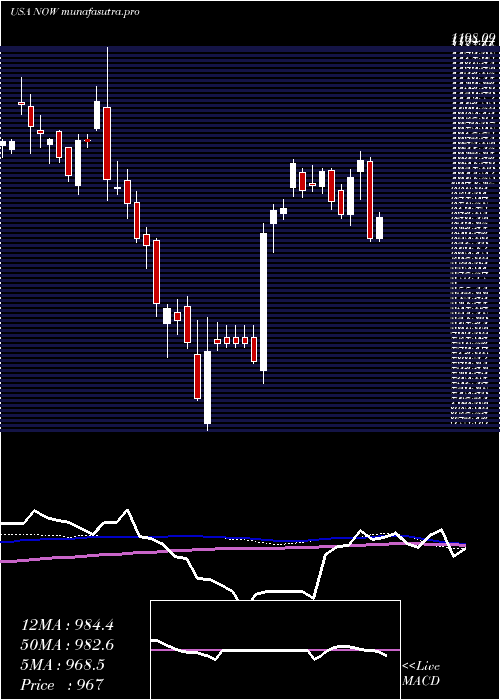
Weekly price and charts ServicenowInc Strong weekly Stock price targets for ServicenowInc NOW are 826.63 and 889.13 | Weekly Target 1 | 775.75 | | Weekly Target 2 | 815 | | Weekly Target 3 | 838.25 | | Weekly Target 4 | 877.5 | | Weekly Target 5 | 900.75 |
Weekly price and volumes for Servicenow Inc
| Date |
Closing |
Open |
Range |
Volume |
Fri 05 December 2025 |
854.25 (5.15%) |
801.67 |
799.00 - 861.50 |
1.0109 times |
Fri 28 November 2025 |
812.41 (-0.13%) |
816.80 |
799.84 - 830.90 |
0.8075 times |
Fri 21 November 2025 |
813.43 (-4.35%) |
846.92 |
795.00 - 853.48 |
1.3142 times |
Fri 14 November 2025 |
850.43 (-1.33%) |
863.86 |
839.05 - 870.65 |
1.285 times |
Fri 07 November 2025 |
861.87 (-6.25%) |
897.06 |
840.55 - 908.63 |
1.0671 times |
Fri 31 October 2025 |
919.28 (0%) |
943.21 |
903.32 - 947.65 |
0.4502 times |
Fri 31 October 2025 |
919.28 (-1.24%) |
944.07 |
896.93 - 964.83 |
1.9324 times |
Fri 24 October 2025 |
930.80 (3.01%) |
906.64 |
906.35 - 950.00 |
0.8867 times |
Fri 17 October 2025 |
903.60 (-0.07%) |
897.04 |
887.95 - 929.00 |
0.8999 times |
Tue 07 October 2025 |
904.24 (-0.82%) |
911.90 |
893.36 - 929.76 |
0.3461 times |
Fri 03 October 2025 |
911.74 (-2.59%) |
942.06 |
892.25 - 954.56 |
1.0888 times |
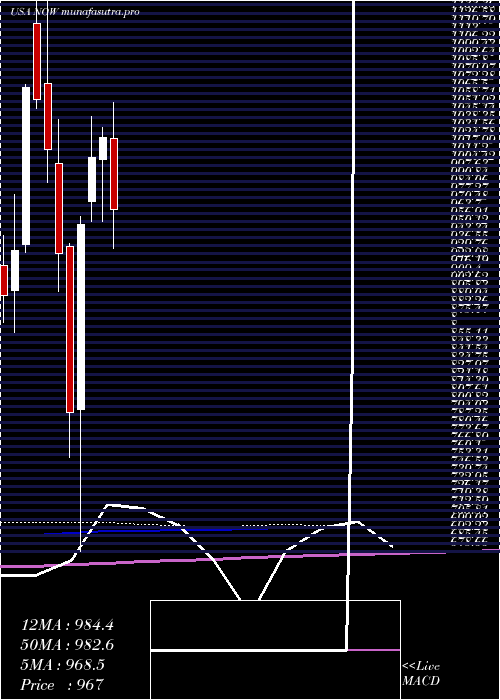
Monthly price and charts ServicenowInc Strong monthly Stock price targets for ServicenowInc NOW are 826.63 and 889.13 | Monthly Target 1 | 775.75 | | Monthly Target 2 | 815 | | Monthly Target 3 | 838.25 | | Monthly Target 4 | 877.5 | | Monthly Target 5 | 900.75 |
Monthly price and volumes Servicenow Inc
| Date |
Closing |
Open |
Range |
Volume |
Fri 05 December 2025 |
854.25 (5.15%) |
801.67 |
799.00 - 861.50 |
0.1802 times |
Fri 28 November 2025 |
812.41 (-11.63%) |
897.06 |
795.00 - 908.63 |
0.7975 times |
Fri 31 October 2025 |
919.28 (-0.11%) |
920.94 |
887.95 - 964.83 |
0.9165 times |
Tue 30 September 2025 |
920.28 (0.31%) |
901.77 |
878.19 - 973.63 |
0.9978 times |
Fri 29 August 2025 |
917.46 (-2.72%) |
937.29 |
840.03 - 937.29 |
1.3778 times |
Thu 31 July 2025 |
943.12 (-8.26%) |
1027.26 |
934.17 - 1057.39 |
1.1468 times |
Mon 30 June 2025 |
1028.08 (1.68%) |
1009.14 |
956.83 - 1036.37 |
0.7148 times |
Fri 30 May 2025 |
1011.09 (5.87%) |
973.86 |
957.52 - 1046.00 |
0.9882 times |
Wed 30 April 2025 |
955.01 (19.96%) |
798.22 |
678.66 - 961.03 |
1.4661 times |
Mon 31 March 2025 |
796.14 (-14.37%) |
936.01 |
757.84 - 939.00 |
1.4143 times |
Fri 28 February 2025 |
929.76 (-8.7%) |
1006.50 |
898.21 - 1043.45 |
1.0303 times |
DMA SMA EMA moving averages of Servicenow Inc NOW
DMA (daily moving average) of Servicenow Inc NOW
| DMA period | DMA value | | 5 day DMA | 834.49 | | 12 day DMA | 821.5 | | 20 day DMA | 833.23 | | 35 day DMA | 869.35 | | 50 day DMA | 883.73 | | 100 day DMA | 903.3 | | 150 day DMA | 936.83 | | 200 day DMA | 913.78 | EMA (exponential moving average) of Servicenow Inc NOW
| EMA period | EMA current | EMA prev | EMA prev2 | | 5 day EMA | 837.25 | 828.75 | 823.69 | | 12 day EMA | 832.92 | 829.04 | 827.25 | | 20 day EMA | 841.14 | 839.76 | 839.85 | | 35 day EMA | 859.67 | 859.99 | 861.23 | | 50 day EMA | 884.2 | 885.42 | 887.32 |
SMA (simple moving average) of Servicenow Inc NOW
| SMA period | SMA current | SMA prev | SMA prev2 | | 5 day SMA | 834.49 | 826.13 | 818.9 | | 12 day SMA | 821.5 | 818.46 | 818.2 | | 20 day SMA | 833.23 | 833.45 | 835.49 | | 35 day SMA | 869.35 | 870.5 | 872.33 | | 50 day SMA | 883.73 | 885.6 | 888.05 | | 100 day SMA | 903.3 | 904.14 | 905.44 | | 150 day SMA | 936.83 | 937.38 | 938.09 | | 200 day SMA | 913.78 | 914.44 | 915.19 |
|
|
