NationalOilwell NOV full analysis,charts,indicators,moving averages,SMA,DMA,EMA,ADX,MACD,RSINational Oilwell NOV WideScreen charts, DMA,SMA,EMA technical analysis, forecast prediction, by indicators ADX,MACD,RSI,CCI USA stock exchange
operates under Energy sector & deals in Metal Fabrications
Daily price and charts and targets NationalOilwell Strong Daily Stock price targets for NationalOilwell NOV are 12.7 and 12.98 | Daily Target 1 | 12.49 | | Daily Target 2 | 12.63 | | Daily Target 3 | 12.773333333333 | | Daily Target 4 | 12.91 | | Daily Target 5 | 13.05 |
Daily price and volume National Oilwell
| Date |
Closing |
Open |
Range |
Volume |
Mon 20 October 2025 |
12.76 (0.79%) |
12.74 |
12.64 - 12.92 |
1.0946 times |
Fri 17 October 2025 |
12.66 (-0.24%) |
12.67 |
12.50 - 12.78 |
0.668 times |
Thu 16 October 2025 |
12.69 (-0.94%) |
12.89 |
12.58 - 12.92 |
0.8358 times |
Wed 15 October 2025 |
12.81 (2.07%) |
12.72 |
12.58 - 12.91 |
0.924 times |
Tue 14 October 2025 |
12.55 (-1.26%) |
12.41 |
12.38 - 12.66 |
0.8157 times |
Mon 13 October 2025 |
12.71 (-7.16%) |
12.56 |
12.38 - 12.77 |
0.7006 times |
Tue 07 October 2025 |
13.69 (0.44%) |
13.64 |
13.55 - 13.90 |
1.4038 times |
Mon 06 October 2025 |
13.63 (-0.37%) |
13.74 |
13.56 - 13.91 |
1.6257 times |
Fri 03 October 2025 |
13.68 (3.4%) |
13.28 |
13.28 - 13.72 |
1.1049 times |
Thu 02 October 2025 |
13.23 (-2.29%) |
13.62 |
13.17 - 13.62 |
0.827 times |
Wed 01 October 2025 |
13.54 (2.19%) |
13.18 |
13.18 - 13.61 |
1.1188 times |
Weekly price and charts NationalOilwell Strong weekly Stock price targets for NationalOilwell NOV are 12.7 and 12.98 | Weekly Target 1 | 12.49 | | Weekly Target 2 | 12.63 | | Weekly Target 3 | 12.773333333333 | | Weekly Target 4 | 12.91 | | Weekly Target 5 | 13.05 |
Weekly price and volumes for National Oilwell
| Date |
Closing |
Open |
Range |
Volume |
Mon 20 October 2025 |
12.76 (0.79%) |
12.74 |
12.64 - 12.92 |
0.2631 times |
Fri 17 October 2025 |
12.66 (-7.52%) |
12.56 |
12.38 - 12.92 |
0.9481 times |
Tue 07 October 2025 |
13.69 (0.07%) |
13.74 |
13.55 - 13.91 |
0.7282 times |
Fri 03 October 2025 |
13.68 (1.48%) |
13.40 |
12.85 - 13.72 |
1.3578 times |
Fri 26 September 2025 |
13.48 (6.81%) |
12.52 |
12.39 - 13.64 |
1.4191 times |
Fri 19 September 2025 |
12.62 (-2.09%) |
13.00 |
12.55 - 13.39 |
1.6348 times |
Fri 12 September 2025 |
12.89 (-3.23%) |
13.36 |
12.74 - 13.46 |
1.216 times |
Fri 05 September 2025 |
13.32 (0.23%) |
13.16 |
12.86 - 13.45 |
1.1425 times |
Fri 29 August 2025 |
13.29 (0%) |
13.20 |
13.14 - 13.35 |
0.2164 times |
Fri 29 August 2025 |
13.29 (1.45%) |
13.04 |
12.78 - 13.35 |
1.074 times |
Fri 22 August 2025 |
13.10 (7.64%) |
12.19 |
12.09 - 13.14 |
1.2712 times |

Monthly price and charts NationalOilwell Strong monthly Stock price targets for NationalOilwell NOV are 11.81 and 13.34 | Monthly Target 1 | 11.49 | | Monthly Target 2 | 12.12 | | Monthly Target 3 | 13.016666666667 | | Monthly Target 4 | 13.65 | | Monthly Target 5 | 14.55 |
Monthly price and volumes National Oilwell
| Date |
Closing |
Open |
Range |
Volume |
Mon 20 October 2025 |
12.76 (-3.7%) |
13.18 |
12.38 - 13.91 |
0.4352 times |
Tue 30 September 2025 |
13.25 (-0.3%) |
13.16 |
12.39 - 13.64 |
0.983 times |
Fri 29 August 2025 |
13.29 (5.64%) |
12.54 |
11.77 - 13.35 |
0.825 times |
Thu 31 July 2025 |
12.58 (1.21%) |
12.48 |
12.28 - 14.24 |
1.1568 times |
Mon 30 June 2025 |
12.43 (3.58%) |
12.06 |
11.65 - 14.06 |
1.0678 times |
Fri 30 May 2025 |
12.00 (3.36%) |
11.57 |
11.55 - 13.44 |
0.9061 times |
Wed 30 April 2025 |
11.61 (-23.72%) |
15.14 |
10.84 - 15.48 |
1.1993 times |
Mon 31 March 2025 |
15.22 (2.01%) |
15.06 |
13.78 - 15.72 |
1.4321 times |
Fri 28 February 2025 |
14.92 (3.25%) |
14.23 |
13.96 - 16.66 |
1.1038 times |
Fri 31 January 2025 |
14.45 (-1.03%) |
14.75 |
14.19 - 15.84 |
0.8908 times |
Tue 31 December 2024 |
14.60 (-8.75%) |
15.14 |
13.94 - 15.53 |
1.0426 times |

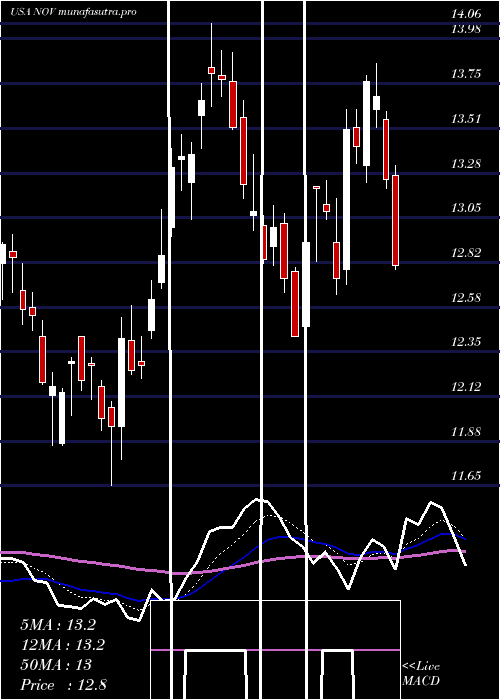
DMA SMA EMA moving averages of National Oilwell NOV
DMA (daily moving average) of National Oilwell NOV
| DMA period | DMA value | | 5 day DMA | 12.69 | | 12 day DMA | 13.1 | | 20 day DMA | 13.09 | | 35 day DMA | 13.11 | | 50 day DMA | 12.9 | | 100 day DMA | 12.91 | | 150 day DMA | 12.92 | | 200 day DMA | 13.44 | EMA (exponential moving average) of National Oilwell NOV
| EMA period | EMA current | EMA prev | EMA prev2 | | 5 day EMA | 12.79 | 12.8 | 12.87 | | 12 day EMA | 12.95 | 12.99 | 13.05 | | 20 day EMA | 13.01 | 13.04 | 13.08 | | 35 day EMA | 12.93 | 12.94 | 12.96 | | 50 day EMA | 12.83 | 12.83 | 12.84 |
SMA (simple moving average) of National Oilwell NOV
| SMA period | SMA current | SMA prev | SMA prev2 | | 5 day SMA | 12.69 | 12.68 | 12.89 | | 12 day SMA | 13.1 | 13.14 | 13.21 | | 20 day SMA | 13.09 | 13.09 | 13.13 | | 35 day SMA | 13.11 | 13.12 | 13.12 | | 50 day SMA | 12.9 | 12.88 | 12.88 | | 100 day SMA | 12.91 | 12.91 | 12.91 | | 150 day SMA | 12.92 | 12.93 | 12.94 | | 200 day SMA | 13.44 | 13.44 | 13.45 |
|
|
