NorthAmerican NOA full analysis,charts,indicators,moving averages,SMA,DMA,EMA,ADX,MACD,RSINorth American NOA WideScreen charts, DMA,SMA,EMA technical analysis, forecast prediction, by indicators ADX,MACD,RSI,CCI USA stock exchange
operates under Energy sector & deals in Oilfield Services Equipment
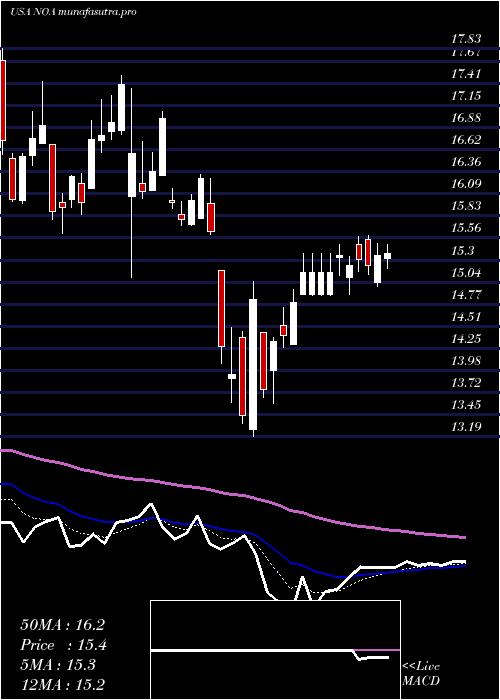
Daily price and charts and targets NorthAmerican Strong Daily Stock price targets for NorthAmerican NOA are 13.82 and 14.28 | Daily Target 1 | 13.73 | | Daily Target 2 | 13.9 | | Daily Target 3 | 14.186666666667 | | Daily Target 4 | 14.36 | | Daily Target 5 | 14.65 |
Daily price and volume North American
| Date |
Closing |
Open |
Range |
Volume |
Fri 05 December 2025 |
14.08 (-0.98%) |
14.41 |
14.01 - 14.47 |
0.8622 times |
Thu 04 December 2025 |
14.22 (-1.39%) |
14.37 |
14.20 - 14.57 |
0.8302 times |
Wed 03 December 2025 |
14.42 (1.62%) |
14.17 |
14.17 - 14.50 |
1.1533 times |
Tue 02 December 2025 |
14.19 (-1.25%) |
14.47 |
14.01 - 14.48 |
0.8133 times |
Mon 01 December 2025 |
14.37 (0.14%) |
14.20 |
14.20 - 14.62 |
1.0394 times |
Fri 28 November 2025 |
14.35 (1.49%) |
14.02 |
14.02 - 14.58 |
0.41 times |
Wed 26 November 2025 |
14.14 (0.43%) |
14.10 |
13.96 - 14.18 |
0.7846 times |
Tue 25 November 2025 |
14.08 (2.25%) |
13.65 |
13.55 - 14.10 |
1.0605 times |
Mon 24 November 2025 |
13.77 (1.47%) |
13.46 |
13.44 - 13.78 |
1.9463 times |
Fri 21 November 2025 |
13.57 (0.44%) |
13.41 |
13.14 - 13.70 |
1.1001 times |
Thu 20 November 2025 |
13.51 (-1.31%) |
13.99 |
13.46 - 14.12 |
1.3212 times |
Weekly price and charts NorthAmerican Strong weekly Stock price targets for NorthAmerican NOA are 13.74 and 14.35 | Weekly Target 1 | 13.63 | | Weekly Target 2 | 13.85 | | Weekly Target 3 | 14.236666666667 | | Weekly Target 4 | 14.46 | | Weekly Target 5 | 14.85 |
Weekly price and volumes for North American
| Date |
Closing |
Open |
Range |
Volume |
Fri 05 December 2025 |
14.08 (-1.88%) |
14.20 |
14.01 - 14.62 |
1.1729 times |
Fri 28 November 2025 |
14.35 (5.75%) |
13.46 |
13.44 - 14.58 |
1.0488 times |
Fri 21 November 2025 |
13.57 (-2.37%) |
13.98 |
13.14 - 14.12 |
2.1324 times |
Fri 14 November 2025 |
13.90 (0.72%) |
13.98 |
13.15 - 15.52 |
1.2195 times |
Fri 07 November 2025 |
13.80 (-11.42%) |
15.26 |
13.63 - 15.26 |
0.8334 times |
Fri 31 October 2025 |
15.58 (0%) |
15.47 |
15.38 - 15.64 |
0.1923 times |
Fri 31 October 2025 |
15.58 (2.23%) |
15.35 |
15.13 - 15.79 |
0.7864 times |
Fri 24 October 2025 |
15.24 (5.98%) |
14.43 |
14.43 - 15.69 |
0.8742 times |
Fri 17 October 2025 |
14.38 (-1.44%) |
13.60 |
13.41 - 14.73 |
0.8677 times |
Tue 07 October 2025 |
14.59 (1.74%) |
14.39 |
14.30 - 15.13 |
0.8725 times |
Fri 03 October 2025 |
14.34 (3.69%) |
13.80 |
13.66 - 14.71 |
1.1072 times |
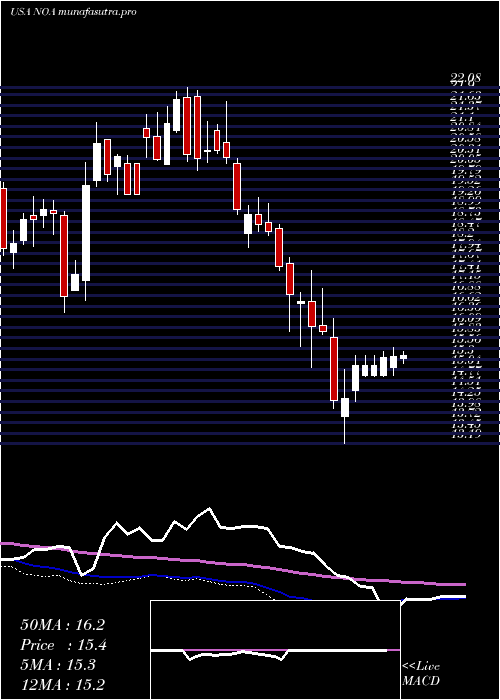
Monthly price and charts NorthAmerican Strong monthly Stock price targets for NorthAmerican NOA are 13.74 and 14.35 | Monthly Target 1 | 13.63 | | Monthly Target 2 | 13.85 | | Monthly Target 3 | 14.236666666667 | | Monthly Target 4 | 14.46 | | Monthly Target 5 | 14.85 |
Monthly price and volumes North American
| Date |
Closing |
Open |
Range |
Volume |
Fri 05 December 2025 |
14.08 (-1.88%) |
14.20 |
14.01 - 14.62 |
0.2859 times |
Fri 28 November 2025 |
14.35 (-7.89%) |
15.26 |
13.14 - 15.52 |
1.2757 times |
Fri 31 October 2025 |
15.58 (9.72%) |
14.12 |
13.41 - 15.79 |
1.0504 times |
Tue 30 September 2025 |
14.20 (3.88%) |
13.52 |
13.10 - 14.26 |
1.0904 times |
Fri 29 August 2025 |
13.67 (-9.05%) |
14.94 |
12.12 - 16.80 |
2.1124 times |
Thu 31 July 2025 |
15.03 (-5.94%) |
15.91 |
14.92 - 17.04 |
0.6675 times |
Mon 30 June 2025 |
15.98 (-6.77%) |
17.31 |
15.81 - 18.24 |
0.5558 times |
Fri 30 May 2025 |
17.14 (12.84%) |
15.17 |
15.17 - 17.67 |
0.828 times |
Wed 30 April 2025 |
15.19 (-3.8%) |
15.72 |
13.19 - 16.32 |
1.1088 times |
Mon 31 March 2025 |
15.79 (-10.28%) |
17.69 |
15.09 - 17.83 |
1.0253 times |
Fri 28 February 2025 |
17.60 (-7.47%) |
18.43 |
17.50 - 19.33 |
0.5031 times |

DMA SMA EMA moving averages of North American NOA
DMA (daily moving average) of North American NOA
| DMA period | DMA value | | 5 day DMA | 14.26 | | 12 day DMA | 14.03 | | 20 day DMA | 13.94 | | 35 day DMA | 14.38 | | 50 day DMA | 14.34 | | 100 day DMA | 14.34 | | 150 day DMA | 15.15 | | 200 day DMA | 15.41 | EMA (exponential moving average) of North American NOA
| EMA period | EMA current | EMA prev | EMA prev2 | | 5 day EMA | 14.19 | 14.24 | 14.25 | | 12 day EMA | 14.12 | 14.13 | 14.11 | | 20 day EMA | 14.13 | 14.14 | 14.13 | | 35 day EMA | 14.14 | 14.14 | 14.14 | | 50 day EMA | 14.29 | 14.3 | 14.3 |
SMA (simple moving average) of North American NOA
| SMA period | SMA current | SMA prev | SMA prev2 | | 5 day SMA | 14.26 | 14.31 | 14.29 | | 12 day SMA | 14.03 | 13.99 | 13.92 | | 20 day SMA | 13.94 | 13.93 | 13.92 | | 35 day SMA | 14.38 | 14.39 | 14.4 | | 50 day SMA | 14.34 | 14.33 | 14.32 | | 100 day SMA | 14.34 | 14.35 | 14.38 | | 150 day SMA | 15.15 | 15.15 | 15.16 | | 200 day SMA | 15.41 | 15.43 | 15.46 |
|
|
