NnInc NNBR full analysis,charts,indicators,moving averages,SMA,DMA,EMA,ADX,MACD,RSINn Inc NNBR WideScreen charts, DMA,SMA,EMA technical analysis, forecast prediction, by indicators ADX,MACD,RSI,CCI USA stock exchange
operates under Capital Goods sector & deals in Metal Fabrications
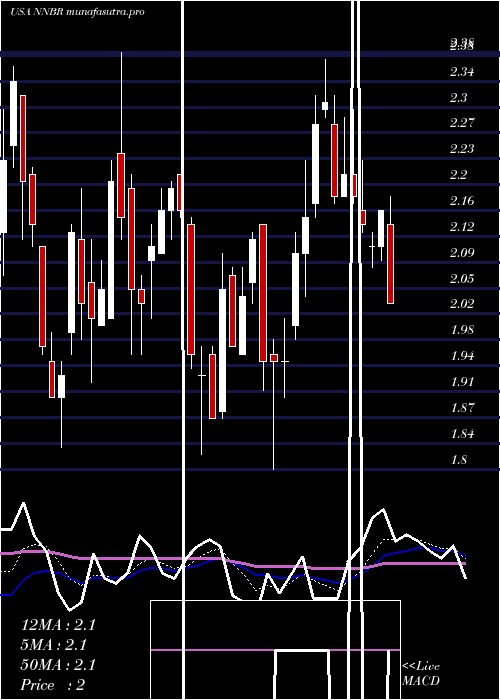
Daily price and charts and targets NnInc Strong Daily Stock price targets for NnInc NNBR are 1.21 and 1.31 | Daily Target 1 | 1.19 | | Daily Target 2 | 1.23 | | Daily Target 3 | 1.29 | | Daily Target 4 | 1.33 | | Daily Target 5 | 1.39 |
Daily price and volume Nn Inc
| Date |
Closing |
Open |
Range |
Volume |
Thu 04 December 2025 |
1.27 (0%) |
1.28 |
1.25 - 1.35 |
1.2918 times |
Wed 03 December 2025 |
1.27 (2.42%) |
1.29 |
1.24 - 1.29 |
0.8226 times |
Tue 02 December 2025 |
1.24 (1.64%) |
1.26 |
1.24 - 1.37 |
1.2793 times |
Mon 01 December 2025 |
1.22 (-3.94%) |
1.27 |
1.22 - 1.32 |
1.1466 times |
Fri 28 November 2025 |
1.27 (1.6%) |
1.26 |
1.25 - 1.30 |
0.3634 times |
Wed 26 November 2025 |
1.25 (-8.09%) |
1.37 |
1.22 - 1.37 |
1.7013 times |
Tue 25 November 2025 |
1.36 (5.43%) |
1.31 |
1.30 - 1.44 |
1.0332 times |
Mon 24 November 2025 |
1.29 (3.2%) |
1.26 |
1.26 - 1.46 |
1.5259 times |
Fri 21 November 2025 |
1.25 (-2.34%) |
1.29 |
1.24 - 1.31 |
0.3967 times |
Thu 20 November 2025 |
1.28 (0.79%) |
1.27 |
1.20 - 1.29 |
0.4391 times |
Wed 19 November 2025 |
1.27 (-5.22%) |
1.33 |
1.26 - 1.36 |
0.5108 times |
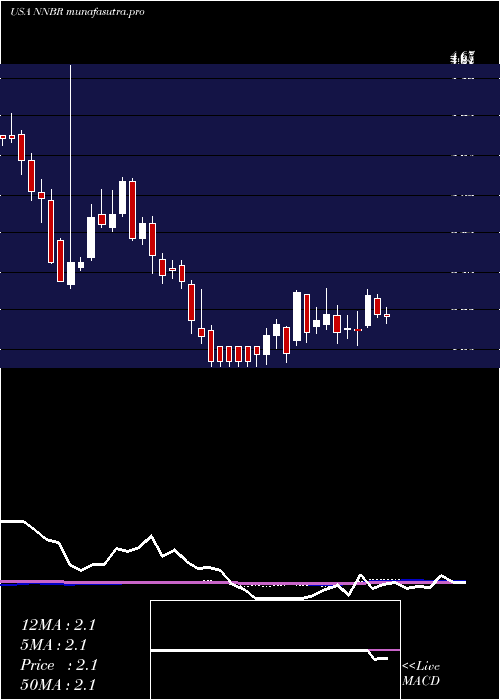
Weekly price and charts NnInc Strong weekly Stock price targets for NnInc NNBR are 1.2 and 1.35 | Weekly Target 1 | 1.14 | | Weekly Target 2 | 1.2 | | Weekly Target 3 | 1.2866666666667 | | Weekly Target 4 | 1.35 | | Weekly Target 5 | 1.44 |
Weekly price and volumes for Nn Inc
| Date |
Closing |
Open |
Range |
Volume |
Thu 04 December 2025 |
1.27 (0%) |
1.27 |
1.22 - 1.37 |
1.9489 times |
Fri 28 November 2025 |
1.27 (1.6%) |
1.26 |
1.22 - 1.46 |
1.9848 times |
Fri 21 November 2025 |
1.25 (-13.79%) |
1.52 |
1.20 - 1.55 |
1.3523 times |
Fri 14 November 2025 |
1.45 (-12.65%) |
1.68 |
1.42 - 1.76 |
1.3132 times |
Fri 07 November 2025 |
1.66 (-2.92%) |
1.78 |
1.62 - 1.89 |
0.4856 times |
Fri 31 October 2025 |
1.71 (0%) |
1.63 |
1.59 - 1.74 |
0.1938 times |
Fri 31 October 2025 |
1.71 (-6.04%) |
1.85 |
1.57 - 1.98 |
1.1679 times |
Fri 24 October 2025 |
1.82 (0.55%) |
1.82 |
1.78 - 1.92 |
0.2746 times |
Fri 17 October 2025 |
1.81 (-0.55%) |
1.98 |
1.73 - 1.99 |
0.5302 times |
Fri 10 October 2025 |
1.82 (-6.67%) |
1.99 |
1.81 - 2.10 |
0.7488 times |
Fri 03 October 2025 |
1.95 (-10.14%) |
2.16 |
1.93 - 2.16 |
0.5255 times |
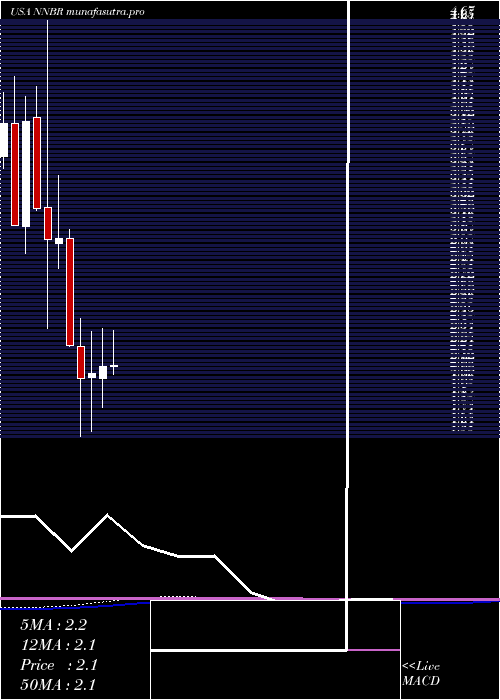
Monthly price and charts NnInc Strong monthly Stock price targets for NnInc NNBR are 1.2 and 1.35 | Monthly Target 1 | 1.14 | | Monthly Target 2 | 1.2 | | Monthly Target 3 | 1.2866666666667 | | Monthly Target 4 | 1.35 | | Monthly Target 5 | 1.44 |
Monthly price and volumes Nn Inc
| Date |
Closing |
Open |
Range |
Volume |
Thu 04 December 2025 |
1.27 (0%) |
1.27 |
1.22 - 1.37 |
0.4886 times |
Fri 28 November 2025 |
1.27 (-25.73%) |
1.78 |
1.20 - 1.89 |
1.2875 times |
Fri 31 October 2025 |
1.71 (-16.99%) |
2.03 |
1.57 - 2.14 |
0.8233 times |
Tue 30 September 2025 |
2.06 (-19.84%) |
2.54 |
2.03 - 2.63 |
0.4088 times |
Fri 29 August 2025 |
2.57 (31.79%) |
1.93 |
1.86 - 2.63 |
0.5662 times |
Thu 31 July 2025 |
1.95 (-7.14%) |
2.10 |
1.94 - 2.37 |
0.5995 times |
Mon 30 June 2025 |
2.10 (2.44%) |
2.01 |
1.80 - 2.38 |
2.8519 times |
Fri 30 May 2025 |
2.05 (1.99%) |
2.02 |
1.62 - 2.36 |
1.1206 times |
Wed 30 April 2025 |
2.01 (-11.06%) |
2.25 |
1.58 - 2.46 |
0.991 times |
Mon 31 March 2025 |
2.26 (-25.9%) |
3.05 |
2.25 - 3.12 |
0.8625 times |
Fri 28 February 2025 |
3.05 (0.33%) |
3.01 |
2.83 - 3.52 |
0.9137 times |
DMA SMA EMA moving averages of Nn Inc NNBR
DMA (daily moving average) of Nn Inc NNBR
| DMA period | DMA value | | 5 day DMA | 1.25 | | 12 day DMA | 1.28 | | 20 day DMA | 1.38 | | 35 day DMA | 1.56 | | 50 day DMA | 1.69 | | 100 day DMA | 1.98 | | 150 day DMA | 2.01 | | 200 day DMA | 2.08 | EMA (exponential moving average) of Nn Inc NNBR
| EMA period | EMA current | EMA prev | EMA prev2 | | 5 day EMA | 1.26 | 1.26 | 1.26 | | 12 day EMA | 1.31 | 1.32 | 1.33 | | 20 day EMA | 1.4 | 1.41 | 1.42 | | 35 day EMA | 1.52 | 1.53 | 1.55 | | 50 day EMA | 1.69 | 1.71 | 1.73 |
SMA (simple moving average) of Nn Inc NNBR
| SMA period | SMA current | SMA prev | SMA prev2 | | 5 day SMA | 1.25 | 1.25 | 1.27 | | 12 day SMA | 1.28 | 1.29 | 1.3 | | 20 day SMA | 1.38 | 1.41 | 1.44 | | 35 day SMA | 1.56 | 1.58 | 1.6 | | 50 day SMA | 1.69 | 1.71 | 1.73 | | 100 day SMA | 1.98 | 1.99 | 2 | | 150 day SMA | 2.01 | 2.01 | 2.02 | | 200 day SMA | 2.08 | 2.09 | 2.1 |
|
|
