AnnalyCapital NLY full analysis,charts,indicators,moving averages,SMA,DMA,EMA,ADX,MACD,RSIAnnaly Capital NLY WideScreen charts, DMA,SMA,EMA technical analysis, forecast prediction, by indicators ADX,MACD,RSI,CCI USA stock exchange
operates under Consumer Services sector & deals in Real Estate Investment Trusts
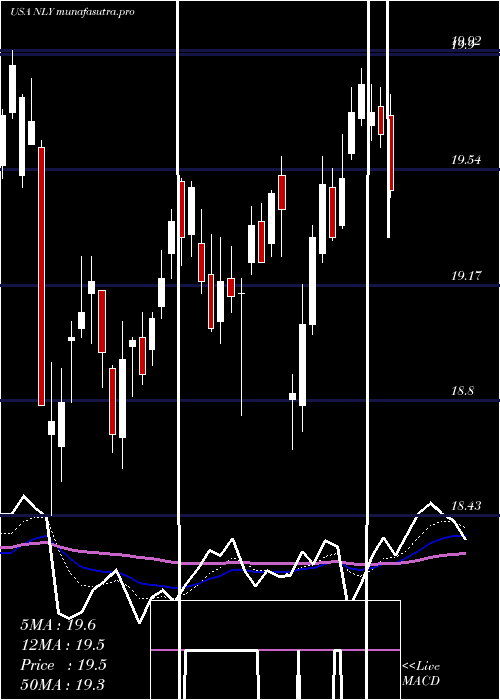
Daily price and charts and targets AnnalyCapital Strong Daily Stock price targets for AnnalyCapital NLY are 22.58 and 22.85 | Daily Target 1 | 22.52 | | Daily Target 2 | 22.64 | | Daily Target 3 | 22.786666666667 | | Daily Target 4 | 22.91 | | Daily Target 5 | 23.06 |
Daily price and volume Annaly Capital
| Date |
Closing |
Open |
Range |
Volume |
Thu 04 December 2025 |
22.77 (-0.22%) |
22.86 |
22.66 - 22.93 |
0.7807 times |
Wed 03 December 2025 |
22.82 (0.04%) |
22.87 |
22.71 - 22.94 |
1.1335 times |
Tue 02 December 2025 |
22.81 (-0.31%) |
22.93 |
22.79 - 22.98 |
0.7575 times |
Mon 01 December 2025 |
22.88 (0.35%) |
22.68 |
22.63 - 22.94 |
1.2275 times |
Fri 28 November 2025 |
22.80 (0.53%) |
22.68 |
22.68 - 22.85 |
0.7079 times |
Wed 26 November 2025 |
22.68 (1.02%) |
22.46 |
22.42 - 22.80 |
0.898 times |
Tue 25 November 2025 |
22.45 (2.37%) |
21.96 |
21.95 - 22.46 |
1.304 times |
Mon 24 November 2025 |
21.93 (-0.27%) |
22.03 |
21.77 - 22.09 |
0.9022 times |
Fri 21 November 2025 |
21.99 (1.71%) |
21.72 |
21.67 - 22.11 |
1.2286 times |
Thu 20 November 2025 |
21.62 (0.09%) |
21.72 |
21.57 - 21.96 |
1.0601 times |
Wed 19 November 2025 |
21.60 (0.19%) |
21.58 |
21.48 - 21.68 |
0.7094 times |
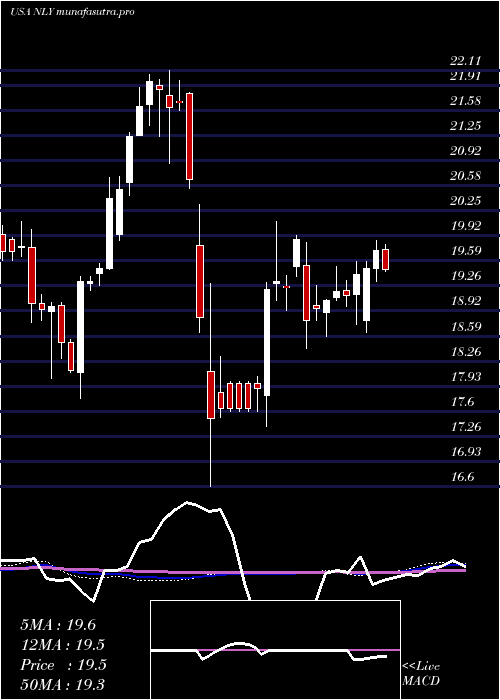
Weekly price and charts AnnalyCapital Strong weekly Stock price targets for AnnalyCapital NLY are 22.7 and 23.05 | Weekly Target 1 | 22.44 | | Weekly Target 2 | 22.61 | | Weekly Target 3 | 22.793333333333 | | Weekly Target 4 | 22.96 | | Weekly Target 5 | 23.14 |
Weekly price and volumes for Annaly Capital
| Date |
Closing |
Open |
Range |
Volume |
Thu 04 December 2025 |
22.77 (-0.13%) |
22.68 |
22.63 - 22.98 |
0.9218 times |
Fri 28 November 2025 |
22.80 (3.68%) |
22.03 |
21.77 - 22.85 |
0.9012 times |
Fri 21 November 2025 |
21.99 (1.57%) |
21.68 |
21.39 - 22.11 |
1.191 times |
Fri 14 November 2025 |
21.65 (-1.1%) |
21.90 |
21.58 - 22.14 |
1.2906 times |
Fri 07 November 2025 |
21.89 (3.4%) |
21.22 |
21.09 - 21.92 |
0.909 times |
Fri 31 October 2025 |
21.17 (0%) |
20.71 |
20.58 - 21.18 |
0.4163 times |
Fri 31 October 2025 |
21.17 (1.05%) |
21.09 |
20.50 - 21.22 |
1.4957 times |
Fri 24 October 2025 |
20.95 (0.72%) |
20.81 |
20.68 - 21.39 |
1.2202 times |
Fri 17 October 2025 |
20.80 (0.97%) |
20.69 |
20.39 - 20.93 |
1.1459 times |
Tue 07 October 2025 |
20.60 (-0.72%) |
20.77 |
20.40 - 20.80 |
0.5082 times |
Fri 03 October 2025 |
20.75 (-1.38%) |
21.10 |
20.00 - 21.12 |
1.6395 times |
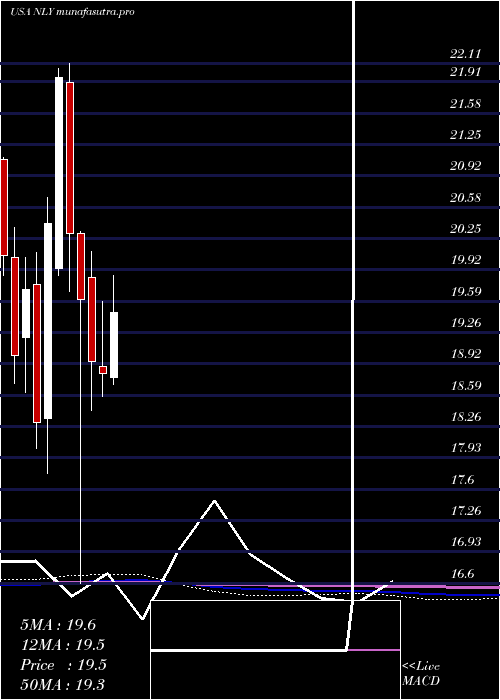
Monthly price and charts AnnalyCapital Strong monthly Stock price targets for AnnalyCapital NLY are 22.7 and 23.05 | Monthly Target 1 | 22.44 | | Monthly Target 2 | 22.61 | | Monthly Target 3 | 22.793333333333 | | Monthly Target 4 | 22.96 | | Monthly Target 5 | 23.14 |
Monthly price and volumes Annaly Capital
| Date |
Closing |
Open |
Range |
Volume |
Thu 04 December 2025 |
22.77 (-0.13%) |
22.68 |
22.63 - 22.98 |
0.1677 times |
Fri 28 November 2025 |
22.80 (7.7%) |
21.22 |
21.09 - 22.85 |
0.7807 times |
Fri 31 October 2025 |
21.17 (4.75%) |
20.22 |
20.22 - 21.39 |
1.0165 times |
Tue 30 September 2025 |
20.21 (-4.62%) |
20.88 |
20.00 - 22.45 |
1.3256 times |
Fri 29 August 2025 |
21.19 (4.23%) |
20.35 |
20.21 - 21.20 |
0.8943 times |
Thu 31 July 2025 |
20.33 (8.02%) |
18.78 |
18.70 - 21.00 |
1.1157 times |
Mon 30 June 2025 |
18.82 (-0.69%) |
18.90 |
18.58 - 19.58 |
1.0402 times |
Fri 30 May 2025 |
18.95 (-3.32%) |
19.84 |
18.43 - 20.11 |
1.1543 times |
Wed 30 April 2025 |
19.60 (-3.5%) |
20.31 |
16.60 - 20.33 |
1.3661 times |
Mon 31 March 2025 |
20.31 (-7.51%) |
21.91 |
19.69 - 22.11 |
1.1389 times |
Fri 28 February 2025 |
21.96 (7.59%) |
19.93 |
19.86 - 22.05 |
1.1385 times |
DMA SMA EMA moving averages of Annaly Capital NLY
DMA (daily moving average) of Annaly Capital NLY
| DMA period | DMA value | | 5 day DMA | 22.82 | | 12 day DMA | 22.33 | | 20 day DMA | 22.09 | | 35 day DMA | 21.65 | | 50 day DMA | 21.37 | | 100 day DMA | 21.14 | | 150 day DMA | 20.52 | | 200 day DMA | 20.43 | EMA (exponential moving average) of Annaly Capital NLY
| EMA period | EMA current | EMA prev | EMA prev2 | | 5 day EMA | 22.73 | 22.71 | 22.66 | | 12 day EMA | 22.43 | 22.37 | 22.29 | | 20 day EMA | 22.17 | 22.11 | 22.03 | | 35 day EMA | 21.84 | 21.79 | 21.73 | | 50 day EMA | 21.55 | 21.5 | 21.45 |
SMA (simple moving average) of Annaly Capital NLY
| SMA period | SMA current | SMA prev | SMA prev2 | | 5 day SMA | 22.82 | 22.8 | 22.72 | | 12 day SMA | 22.33 | 22.22 | 22.12 | | 20 day SMA | 22.09 | 22.04 | 21.97 | | 35 day SMA | 21.65 | 21.59 | 21.53 | | 50 day SMA | 21.37 | 21.35 | 21.32 | | 100 day SMA | 21.14 | 21.12 | 21.08 | | 150 day SMA | 20.52 | 20.5 | 20.47 | | 200 day SMA | 20.43 | 20.42 | 20.41 |
|
|
