NlIndustries NL full analysis,charts,indicators,moving averages,SMA,DMA,EMA,ADX,MACD,RSINl Industries NL WideScreen charts, DMA,SMA,EMA technical analysis, forecast prediction, by indicators ADX,MACD,RSI,CCI USA stock exchange
operates under Basic Industries sector & deals in Major Chemicals
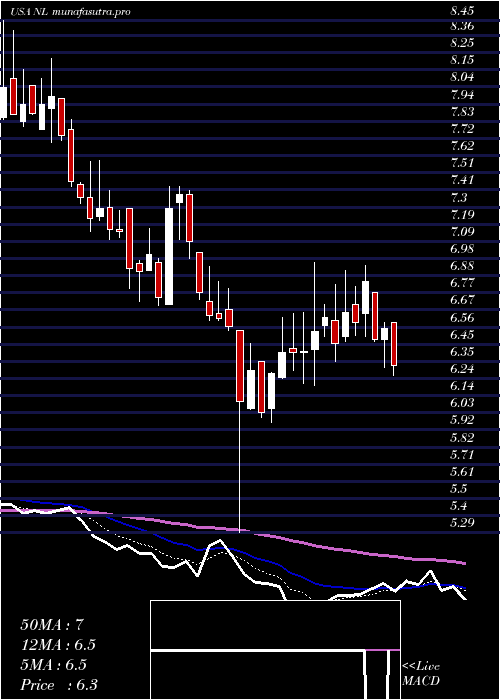
Daily price and charts and targets NlIndustries Strong Daily Stock price targets for NlIndustries NL are 5.57 and 5.79 | Daily Target 1 | 5.4 | | Daily Target 2 | 5.51 | | Daily Target 3 | 5.6233333333333 | | Daily Target 4 | 5.73 | | Daily Target 5 | 5.84 |
Daily price and volume Nl Industries
| Date |
Closing |
Open |
Range |
Volume |
Thu 04 December 2025 |
5.61 (0.54%) |
5.58 |
5.52 - 5.74 |
0.6135 times |
Wed 03 December 2025 |
5.58 (2.39%) |
5.43 |
5.29 - 5.64 |
1.864 times |
Tue 02 December 2025 |
5.45 (-0.73%) |
5.54 |
5.44 - 5.63 |
0.5197 times |
Mon 01 December 2025 |
5.49 (-2.83%) |
5.51 |
5.46 - 5.65 |
0.422 times |
Fri 28 November 2025 |
5.65 (-1.57%) |
5.58 |
5.56 - 5.72 |
0.2657 times |
Wed 26 November 2025 |
5.74 (5.51%) |
5.41 |
5.39 - 5.75 |
1.6413 times |
Tue 25 November 2025 |
5.44 (-0.37%) |
5.51 |
5.38 - 5.54 |
0.7503 times |
Mon 24 November 2025 |
5.46 (-1.62%) |
5.57 |
5.29 - 5.62 |
1.2778 times |
Fri 21 November 2025 |
5.55 (3.93%) |
5.32 |
5.04 - 5.61 |
1.399 times |
Thu 20 November 2025 |
5.34 (-0.74%) |
5.44 |
5.26 - 5.45 |
1.2466 times |
Wed 19 November 2025 |
5.38 (2.28%) |
5.26 |
5.20 - 5.50 |
1.0551 times |
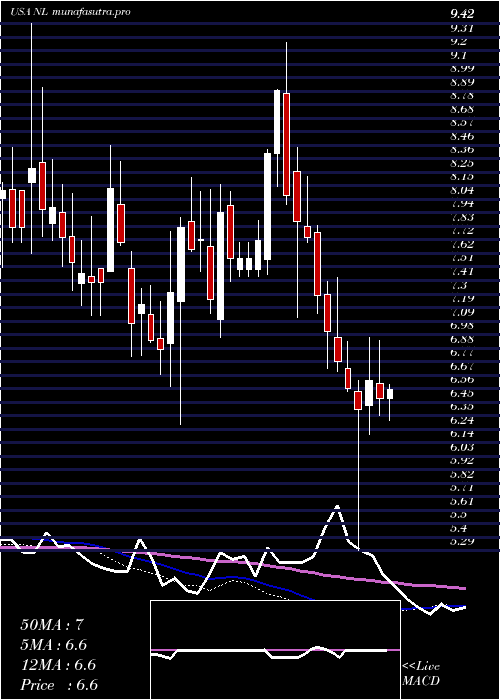
Weekly price and charts NlIndustries Strong weekly Stock price targets for NlIndustries NL are 5.45 and 5.9 | Weekly Target 1 | 5.1 | | Weekly Target 2 | 5.35 | | Weekly Target 3 | 5.5466666666667 | | Weekly Target 4 | 5.8 | | Weekly Target 5 | 6 |
Weekly price and volumes for Nl Industries
| Date |
Closing |
Open |
Range |
Volume |
Thu 04 December 2025 |
5.61 (-0.71%) |
5.51 |
5.29 - 5.74 |
0.6894 times |
Fri 28 November 2025 |
5.65 (1.8%) |
5.57 |
5.29 - 5.75 |
0.7934 times |
Fri 21 November 2025 |
5.55 (1.28%) |
5.50 |
5.04 - 5.61 |
1.2535 times |
Fri 14 November 2025 |
5.48 (-7.12%) |
5.90 |
5.43 - 5.90 |
0.8509 times |
Fri 07 November 2025 |
5.90 (-2.48%) |
5.81 |
5.66 - 6.00 |
0.9951 times |
Fri 31 October 2025 |
6.05 (0%) |
5.75 |
5.71 - 6.09 |
0.3191 times |
Fri 31 October 2025 |
6.05 (-1.79%) |
6.15 |
5.71 - 6.27 |
1.4536 times |
Fri 24 October 2025 |
6.16 (6.94%) |
5.81 |
5.69 - 6.23 |
1.5182 times |
Fri 17 October 2025 |
5.76 (-2.7%) |
6.01 |
5.70 - 6.11 |
1.8255 times |
Tue 07 October 2025 |
5.92 (-3.58%) |
6.16 |
5.91 - 6.27 |
0.3014 times |
Fri 03 October 2025 |
6.14 (0.49%) |
6.19 |
6.02 - 6.29 |
0.5718 times |
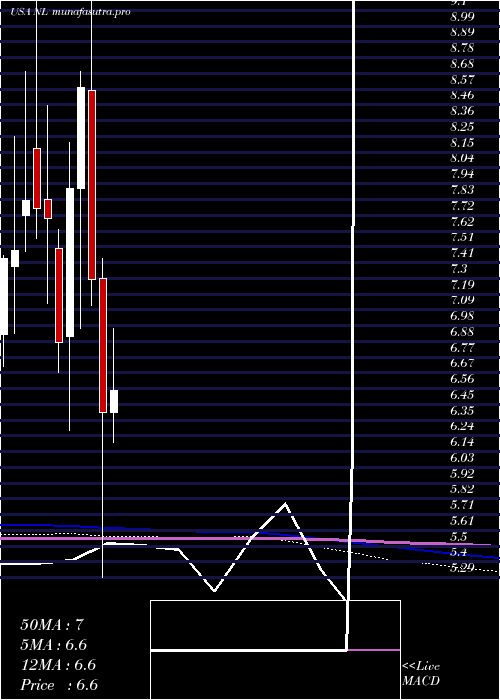
Monthly price and charts NlIndustries Strong monthly Stock price targets for NlIndustries NL are 5.45 and 5.9 | Monthly Target 1 | 5.1 | | Monthly Target 2 | 5.35 | | Monthly Target 3 | 5.5466666666667 | | Monthly Target 4 | 5.8 | | Monthly Target 5 | 6 |
Monthly price and volumes Nl Industries
| Date |
Closing |
Open |
Range |
Volume |
Thu 04 December 2025 |
5.61 (-0.71%) |
5.51 |
5.29 - 5.74 |
0.1374 times |
Fri 28 November 2025 |
5.65 (-6.61%) |
5.81 |
5.04 - 6.00 |
0.7756 times |
Fri 31 October 2025 |
6.05 (-1.63%) |
6.15 |
5.69 - 6.29 |
1.1518 times |
Tue 30 September 2025 |
6.15 (-5.96%) |
6.55 |
5.81 - 6.76 |
0.9668 times |
Fri 29 August 2025 |
6.54 (6%) |
6.08 |
5.45 - 6.82 |
0.9687 times |
Thu 31 July 2025 |
6.17 (-3.59%) |
6.40 |
5.98 - 6.96 |
1.3606 times |
Mon 30 June 2025 |
6.40 (-12.21%) |
7.30 |
5.29 - 7.43 |
2.0173 times |
Fri 30 May 2025 |
7.29 (-15.03%) |
8.56 |
7.12 - 9.27 |
0.9446 times |
Wed 30 April 2025 |
8.58 (8.61%) |
7.90 |
6.96 - 8.69 |
0.8707 times |
Mon 31 March 2025 |
7.90 (14.99%) |
6.91 |
6.28 - 8.21 |
0.8065 times |
Fri 28 February 2025 |
6.87 (-10.78%) |
7.50 |
6.67 - 7.63 |
0.7165 times |
DMA SMA EMA moving averages of Nl Industries NL
DMA (daily moving average) of Nl Industries NL
| DMA period | DMA value | | 5 day DMA | 5.56 | | 12 day DMA | 5.5 | | 20 day DMA | 5.55 | | 35 day DMA | 5.69 | | 50 day DMA | 5.8 | | 100 day DMA | 6.07 | | 150 day DMA | 6.5 | | 200 day DMA | 6.74 | EMA (exponential moving average) of Nl Industries NL
| EMA period | EMA current | EMA prev | EMA prev2 | | 5 day EMA | 5.56 | 5.54 | 5.52 | | 12 day EMA | 5.56 | 5.55 | 5.54 | | 20 day EMA | 5.58 | 5.58 | 5.58 | | 35 day EMA | 5.69 | 5.69 | 5.7 | | 50 day EMA | 5.8 | 5.81 | 5.82 |
SMA (simple moving average) of Nl Industries NL
| SMA period | SMA current | SMA prev | SMA prev2 | | 5 day SMA | 5.56 | 5.58 | 5.55 | | 12 day SMA | 5.5 | 5.46 | 5.46 | | 20 day SMA | 5.55 | 5.57 | 5.57 | | 35 day SMA | 5.69 | 5.71 | 5.71 | | 50 day SMA | 5.8 | 5.8 | 5.82 | | 100 day SMA | 6.07 | 6.09 | 6.1 | | 150 day SMA | 6.5 | 6.52 | 6.54 | | 200 day SMA | 6.74 | 6.75 | 6.75 |
|
|
