Nice NICE full analysis,charts,indicators,moving averages,SMA,DMA,EMA,ADX,MACD,RSINice NICE WideScreen charts, DMA,SMA,EMA technical analysis, forecast prediction, by indicators ADX,MACD,RSI,CCI USA stock exchange
operates under Technology sector & deals in Computer Manufacturing
Daily price and charts and targets Nice Strong Daily Stock price targets for Nice NICE are 106.52 and 110.04 | Daily Target 1 | 103.78 | | Daily Target 2 | 105.73 | | Daily Target 3 | 107.30333333333 | | Daily Target 4 | 109.25 | | Daily Target 5 | 110.82 |
Daily price and volume Nice
| Date |
Closing |
Open |
Range |
Volume |
Thu 04 December 2025 |
107.67 (1.37%) |
106.21 |
105.36 - 108.88 |
0.9426 times |
Wed 03 December 2025 |
106.22 (-1.66%) |
106.90 |
105.94 - 108.63 |
0.747 times |
Tue 02 December 2025 |
108.01 (1.6%) |
106.96 |
106.38 - 109.24 |
0.696 times |
Mon 01 December 2025 |
106.31 (0.23%) |
104.19 |
104.13 - 108.39 |
0.8056 times |
Fri 28 November 2025 |
106.07 (0.8%) |
104.91 |
104.50 - 106.65 |
0.4898 times |
Wed 26 November 2025 |
105.23 (1.69%) |
103.50 |
103.15 - 106.00 |
0.8265 times |
Tue 25 November 2025 |
103.48 (-1.82%) |
104.44 |
102.94 - 105.44 |
0.9505 times |
Mon 24 November 2025 |
105.40 (0.28%) |
107.12 |
104.67 - 108.76 |
1.3062 times |
Fri 21 November 2025 |
105.11 (5.53%) |
100.68 |
99.17 - 105.65 |
1.7662 times |
Thu 20 November 2025 |
99.60 (-2%) |
102.27 |
99.00 - 102.49 |
1.4697 times |
Wed 19 November 2025 |
101.63 (-3.68%) |
105.00 |
99.12 - 105.54 |
1.9785 times |
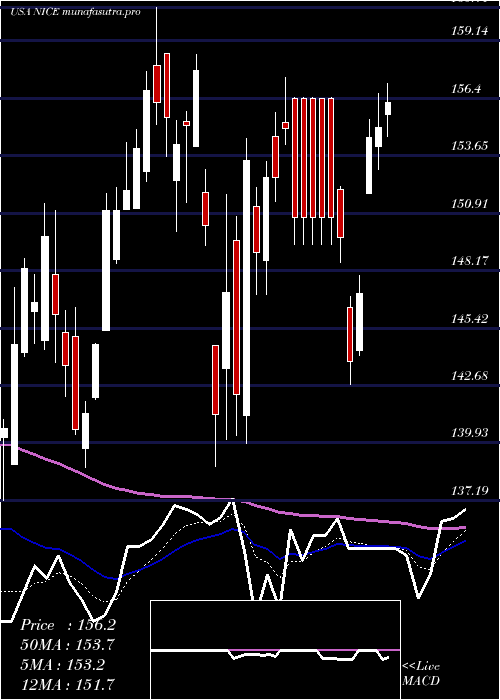
Weekly price and charts Nice Strong weekly Stock price targets for Nice NICE are 105.9 and 111.01 | Weekly Target 1 | 101.9 | | Weekly Target 2 | 104.79 | | Weekly Target 3 | 107.01333333333 | | Weekly Target 4 | 109.9 | | Weekly Target 5 | 112.12 |
Weekly price and volumes for Nice
| Date |
Closing |
Open |
Range |
Volume |
Thu 04 December 2025 |
107.67 (1.51%) |
104.19 |
104.13 - 109.24 |
0.8811 times |
Fri 28 November 2025 |
106.07 (0.91%) |
107.12 |
102.94 - 108.76 |
0.9865 times |
Fri 21 November 2025 |
105.11 (-21.2%) |
136.50 |
99.00 - 136.53 |
2.9347 times |
Fri 14 November 2025 |
133.38 (7.57%) |
124.47 |
123.69 - 136.00 |
1.6084 times |
Fri 07 November 2025 |
123.99 (-9.27%) |
133.70 |
122.94 - 133.70 |
0.6199 times |
Fri 31 October 2025 |
136.66 (0%) |
136.04 |
135.12 - 137.82 |
0.0831 times |
Fri 31 October 2025 |
136.66 (3.3%) |
133.70 |
132.62 - 137.82 |
0.6213 times |
Fri 24 October 2025 |
132.30 (1.86%) |
131.76 |
130.72 - 137.05 |
0.7387 times |
Fri 17 October 2025 |
129.88 (-2.97%) |
135.10 |
126.66 - 135.50 |
0.813 times |
Fri 10 October 2025 |
133.85 (-3.15%) |
139.24 |
132.60 - 140.48 |
0.7132 times |
Fri 03 October 2025 |
138.20 (-5.2%) |
148.00 |
137.48 - 149.29 |
0.7293 times |
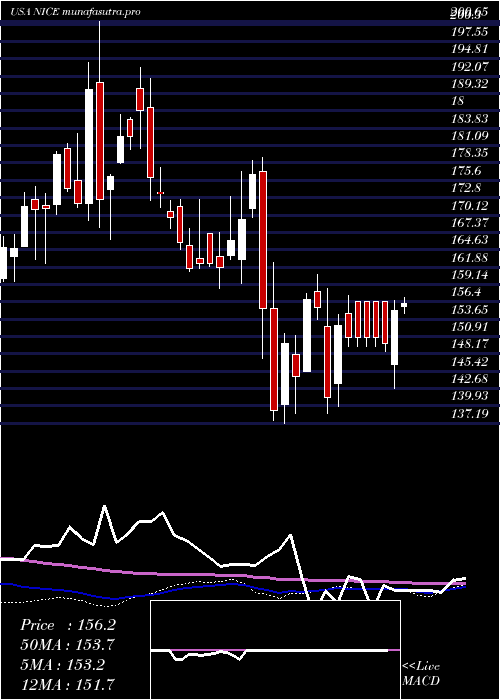
Monthly price and charts Nice Strong monthly Stock price targets for Nice NICE are 105.9 and 111.01 | Monthly Target 1 | 101.9 | | Monthly Target 2 | 104.79 | | Monthly Target 3 | 107.01333333333 | | Monthly Target 4 | 109.9 | | Monthly Target 5 | 112.12 |
Monthly price and volumes Nice
| Date |
Closing |
Open |
Range |
Volume |
Thu 04 December 2025 |
107.67 (1.51%) |
104.19 |
104.13 - 109.24 |
0.2661 times |
Fri 28 November 2025 |
106.07 (-22.38%) |
133.70 |
99.00 - 136.53 |
1.8572 times |
Fri 31 October 2025 |
136.66 (-5.61%) |
144.05 |
126.66 - 145.43 |
1.0095 times |
Tue 30 September 2025 |
144.78 (2.43%) |
141.28 |
134.46 - 153.68 |
1.141 times |
Fri 29 August 2025 |
141.35 (-9.42%) |
155.00 |
127.00 - 156.37 |
1.5042 times |
Thu 31 July 2025 |
156.05 (-7.61%) |
169.15 |
150.08 - 175.00 |
0.967 times |
Mon 30 June 2025 |
168.91 (1.8%) |
163.93 |
158.75 - 180.61 |
0.6925 times |
Fri 30 May 2025 |
165.93 (6.46%) |
156.88 |
152.67 - 171.23 |
0.833 times |
Wed 30 April 2025 |
155.86 (1.1%) |
155.29 |
138.79 - 158.47 |
0.6451 times |
Mon 31 March 2025 |
154.17 (10.77%) |
140.19 |
137.19 - 160.74 |
1.0845 times |
Fri 28 February 2025 |
139.18 (-16.23%) |
163.00 |
137.66 - 179.17 |
1.4927 times |

DMA SMA EMA moving averages of Nice NICE
DMA (daily moving average) of Nice NICE
| DMA period | DMA value | | 5 day DMA | 106.86 | | 12 day DMA | 105.02 | | 20 day DMA | 113.74 | | 35 day DMA | 122.02 | | 50 day DMA | 126.9 | | 100 day DMA | 137.06 | | 150 day DMA | 146.59 | | 200 day DMA | 147.6 | EMA (exponential moving average) of Nice NICE
| EMA period | EMA current | EMA prev | EMA prev2 | | 5 day EMA | 106.88 | 106.49 | 106.63 | | 12 day EMA | 108.98 | 109.22 | 109.76 | | 20 day EMA | 113.1 | 113.67 | 114.45 | | 35 day EMA | 119.67 | 120.38 | 121.21 | | 50 day EMA | 126.87 | 127.65 | 128.52 |
SMA (simple moving average) of Nice NICE
| SMA period | SMA current | SMA prev | SMA prev2 | | 5 day SMA | 106.86 | 106.37 | 105.82 | | 12 day SMA | 105.02 | 106.12 | 108.38 | | 20 day SMA | 113.74 | 114.83 | 116.01 | | 35 day SMA | 122.02 | 122.61 | 123.33 | | 50 day SMA | 126.9 | 127.79 | 128.65 | | 100 day SMA | 137.06 | 137.5 | 137.95 | | 150 day SMA | 146.59 | 146.91 | 147.24 | | 200 day SMA | 147.6 | 147.95 | 148.3 |
|
|
