NaturalHealth NHTC full analysis,charts,indicators,moving averages,SMA,DMA,EMA,ADX,MACD,RSINatural Health NHTC WideScreen charts, DMA,SMA,EMA technical analysis, forecast prediction, by indicators ADX,MACD,RSI,CCI USA stock exchange
operates under Consumer Durables sector & deals in Consumer Specialties
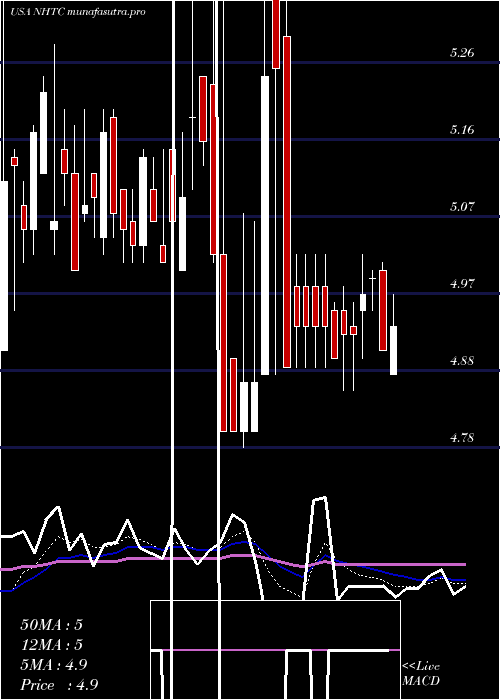
Daily price and charts and targets NaturalHealth Strong Daily Stock price targets for NaturalHealth NHTC are 4.46 and 4.62 | Daily Target 1 | 4.35 | | Daily Target 2 | 4.41 | | Daily Target 3 | 4.5066666666667 | | Daily Target 4 | 4.57 | | Daily Target 5 | 4.67 |
Daily price and volume Natural Health
| Date |
Closing |
Open |
Range |
Volume |
Fri 17 October 2025 |
4.48 (1.13%) |
4.44 |
4.44 - 4.60 |
0.4193 times |
Thu 16 October 2025 |
4.43 (-2.42%) |
4.40 |
4.38 - 4.68 |
1.2801 times |
Wed 15 October 2025 |
4.54 (2.25%) |
4.53 |
4.36 - 4.61 |
1.3111 times |
Tue 14 October 2025 |
4.44 (0.45%) |
4.45 |
4.36 - 4.52 |
0.5879 times |
Mon 13 October 2025 |
4.42 (-4.33%) |
4.60 |
4.30 - 4.60 |
1.5618 times |
Fri 10 October 2025 |
4.62 (5.96%) |
4.35 |
4.35 - 4.74 |
1.7304 times |
Thu 09 October 2025 |
4.36 (1.16%) |
4.34 |
4.32 - 4.45 |
0.7299 times |
Wed 08 October 2025 |
4.31 (2.38%) |
4.27 |
4.25 - 4.52 |
1.2268 times |
Tue 07 October 2025 |
4.21 (-1.64%) |
4.29 |
4.21 - 4.31 |
0.5457 times |
Mon 06 October 2025 |
4.28 (-1.15%) |
4.30 |
4.25 - 4.35 |
0.6069 times |
Fri 03 October 2025 |
4.33 (0.46%) |
4.33 |
4.31 - 4.45 |
0.1841 times |
Weekly price and charts NaturalHealth Strong weekly Stock price targets for NaturalHealth NHTC are 4.2 and 4.58 | Weekly Target 1 | 4.11 | | Weekly Target 2 | 4.29 | | Weekly Target 3 | 4.4866666666667 | | Weekly Target 4 | 4.67 | | Weekly Target 5 | 4.87 |
Weekly price and volumes for Natural Health
| Date |
Closing |
Open |
Range |
Volume |
Fri 17 October 2025 |
4.48 (-3.03%) |
4.60 |
4.30 - 4.68 |
2.0434 times |
Fri 10 October 2025 |
4.62 (6.7%) |
4.30 |
4.21 - 4.74 |
1.9165 times |
Fri 03 October 2025 |
4.33 (-2.48%) |
4.48 |
4.30 - 4.55 |
0.5057 times |
Fri 26 September 2025 |
4.44 (-2.63%) |
4.57 |
4.39 - 4.74 |
0.7801 times |
Fri 19 September 2025 |
4.56 (-2.56%) |
4.70 |
4.44 - 4.72 |
0.7432 times |
Fri 12 September 2025 |
4.68 (2.41%) |
4.58 |
4.58 - 4.75 |
0.7678 times |
Fri 05 September 2025 |
4.57 (3.86%) |
4.42 |
4.40 - 4.64 |
0.723 times |
Fri 29 August 2025 |
4.40 (0%) |
4.35 |
4.35 - 4.40 |
0.0878 times |
Fri 29 August 2025 |
4.40 (0.92%) |
4.36 |
4.32 - 4.51 |
0.6501 times |
Fri 22 August 2025 |
4.36 (1.16%) |
4.30 |
4.20 - 4.57 |
1.7825 times |
Fri 15 August 2025 |
4.31 (-12.04%) |
5.00 |
4.25 - 5.10 |
4.352 times |
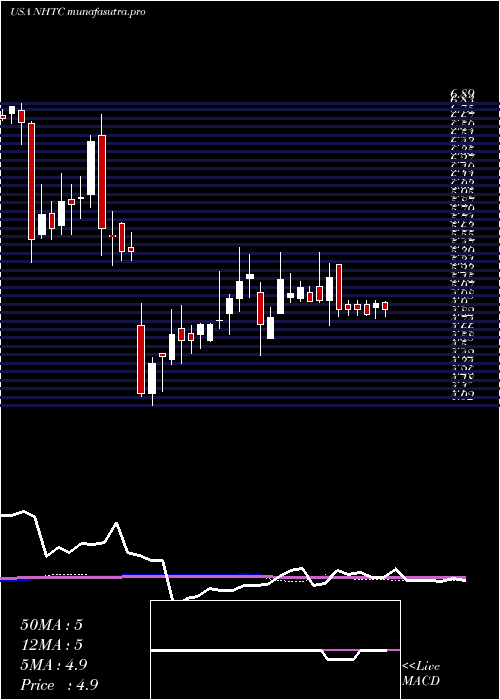
Monthly price and charts NaturalHealth Strong monthly Stock price targets for NaturalHealth NHTC are 4.08 and 4.61 | Monthly Target 1 | 3.95 | | Monthly Target 2 | 4.21 | | Monthly Target 3 | 4.4766666666667 | | Monthly Target 4 | 4.74 | | Monthly Target 5 | 5.01 |
Monthly price and volumes Natural Health
| Date |
Closing |
Open |
Range |
Volume |
Fri 17 October 2025 |
4.48 (0.22%) |
4.50 |
4.21 - 4.74 |
0.9783 times |
Tue 30 September 2025 |
4.47 (1.59%) |
4.42 |
4.36 - 4.75 |
0.7598 times |
Fri 29 August 2025 |
4.40 (-5.58%) |
4.66 |
4.20 - 5.10 |
2.0552 times |
Thu 31 July 2025 |
4.66 (7.62%) |
4.38 |
4.35 - 4.80 |
0.5967 times |
Mon 30 June 2025 |
4.33 (-9.98%) |
4.90 |
4.27 - 4.94 |
0.7059 times |
Fri 30 May 2025 |
4.81 (-3.02%) |
4.98 |
4.12 - 6.00 |
1.8846 times |
Wed 30 April 2025 |
4.96 (-1.98%) |
5.00 |
4.78 - 5.48 |
0.6465 times |
Mon 31 March 2025 |
5.06 (4.12%) |
4.90 |
4.90 - 5.48 |
0.5707 times |
Fri 28 February 2025 |
4.86 (-3.57%) |
5.04 |
4.50 - 5.52 |
1.059 times |
Fri 31 January 2025 |
5.04 (9.09%) |
4.64 |
4.42 - 5.30 |
0.7433 times |
Tue 31 December 2024 |
4.62 (-15.85%) |
4.78 |
4.02 - 4.99 |
0.8863 times |

DMA SMA EMA moving averages of Natural Health NHTC
DMA (daily moving average) of Natural Health NHTC
| DMA period | DMA value | | 5 day DMA | 4.46 | | 12 day DMA | 4.39 | | 20 day DMA | 4.42 | | 35 day DMA | 4.48 | | 50 day DMA | 4.46 | | 100 day DMA | 4.54 | | 150 day DMA | 4.68 | | 200 day DMA | 4.74 | EMA (exponential moving average) of Natural Health NHTC
| EMA period | EMA current | EMA prev | EMA prev2 | | 5 day EMA | 4.47 | 4.46 | 4.47 | | 12 day EMA | 4.44 | 4.43 | 4.43 | | 20 day EMA | 4.44 | 4.44 | 4.44 | | 35 day EMA | 4.46 | 4.46 | 4.46 | | 50 day EMA | 4.49 | 4.49 | 4.49 |
SMA (simple moving average) of Natural Health NHTC
| SMA period | SMA current | SMA prev | SMA prev2 | | 5 day SMA | 4.46 | 4.49 | 4.48 | | 12 day SMA | 4.39 | 4.38 | 4.39 | | 20 day SMA | 4.42 | 4.43 | 4.43 | | 35 day SMA | 4.48 | 4.48 | 4.48 | | 50 day SMA | 4.46 | 4.46 | 4.47 | | 100 day SMA | 4.54 | 4.55 | 4.55 | | 150 day SMA | 4.68 | 4.68 | 4.68 | | 200 day SMA | 4.74 | 4.74 | 4.74 |
|
|
