NationalHealth NHI full analysis,charts,indicators,moving averages,SMA,DMA,EMA,ADX,MACD,RSINational Health NHI WideScreen charts, DMA,SMA,EMA technical analysis, forecast prediction, by indicators ADX,MACD,RSI,CCI USA stock exchange
operates under Consumer Services sector & deals in Real Estate Investment Trusts
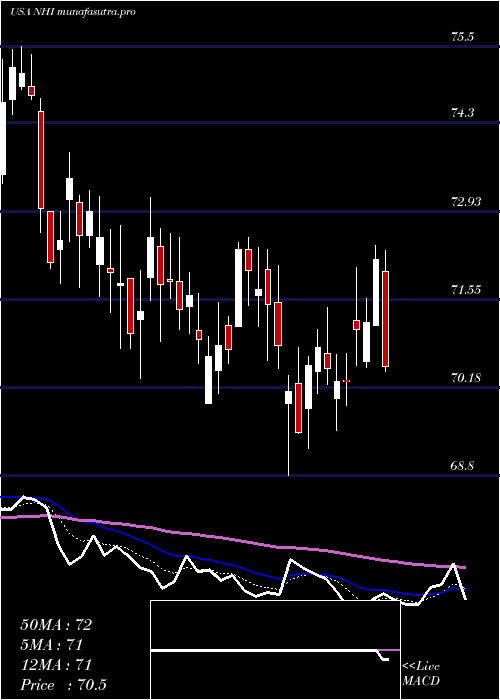
Daily price and charts and targets NationalHealth Strong Daily Stock price targets for NationalHealth NHI are 78.3 and 79.43 | Daily Target 1 | 78.05 | | Daily Target 2 | 78.55 | | Daily Target 3 | 79.183333333333 | | Daily Target 4 | 79.68 | | Daily Target 5 | 80.31 |
Daily price and volume National Health
| Date |
Closing |
Open |
Range |
Volume |
Thu 04 December 2025 |
79.04 (0.24%) |
79.05 |
78.69 - 79.82 |
1.076 times |
Wed 03 December 2025 |
78.85 (0.81%) |
78.44 |
77.69 - 78.94 |
1.2847 times |
Tue 02 December 2025 |
78.22 (-0.05%) |
78.60 |
77.57 - 78.60 |
0.6567 times |
Mon 01 December 2025 |
78.26 (-1.53%) |
78.97 |
77.97 - 79.39 |
0.7388 times |
Fri 28 November 2025 |
79.48 (-0.18%) |
80.08 |
79.30 - 80.08 |
0.4867 times |
Wed 26 November 2025 |
79.62 (0.26%) |
79.11 |
79.11 - 80.53 |
1.0719 times |
Tue 25 November 2025 |
79.41 (0.81%) |
79.16 |
78.36 - 80.05 |
1.0267 times |
Mon 24 November 2025 |
78.77 (-0.11%) |
78.80 |
78.16 - 79.61 |
1.3434 times |
Fri 21 November 2025 |
78.86 (0.9%) |
78.43 |
77.48 - 79.45 |
1.3791 times |
Thu 20 November 2025 |
78.16 (0.41%) |
78.72 |
78.12 - 79.01 |
0.9359 times |
Wed 19 November 2025 |
77.84 (-0.59%) |
78.03 |
77.72 - 79.00 |
0.781 times |
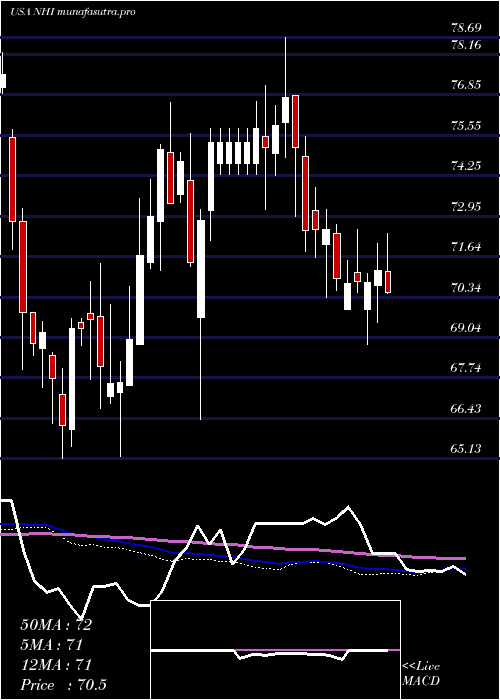
Weekly price and charts NationalHealth Strong weekly Stock price targets for NationalHealth NHI are 78.31 and 80.56 | Weekly Target 1 | 76.56 | | Weekly Target 2 | 77.8 | | Weekly Target 3 | 78.81 | | Weekly Target 4 | 80.05 | | Weekly Target 5 | 81.06 |
Weekly price and volumes for National Health
| Date |
Closing |
Open |
Range |
Volume |
Thu 04 December 2025 |
79.04 (-0.55%) |
78.97 |
77.57 - 79.82 |
0.8442 times |
Fri 28 November 2025 |
79.48 (0.79%) |
78.80 |
78.16 - 80.53 |
0.8829 times |
Fri 21 November 2025 |
78.86 (2.22%) |
77.68 |
77.18 - 79.45 |
1.1004 times |
Fri 14 November 2025 |
77.15 (0.46%) |
76.76 |
75.57 - 77.83 |
1.1644 times |
Fri 07 November 2025 |
76.80 (3.07%) |
74.72 |
73.68 - 77.88 |
1.3684 times |
Fri 31 October 2025 |
74.51 (0%) |
74.77 |
74.06 - 76.46 |
0.3425 times |
Fri 31 October 2025 |
74.51 (-0.88%) |
75.17 |
72.74 - 76.46 |
1.3917 times |
Fri 24 October 2025 |
75.17 (-0.24%) |
75.61 |
74.61 - 76.53 |
0.7493 times |
Fri 17 October 2025 |
75.35 (-0.49%) |
73.62 |
71.50 - 75.79 |
1.6648 times |
Tue 07 October 2025 |
75.72 (-3.53%) |
79.59 |
75.40 - 79.59 |
0.4915 times |
Fri 03 October 2025 |
78.49 (-1.7%) |
79.58 |
77.52 - 80.35 |
1.3099 times |
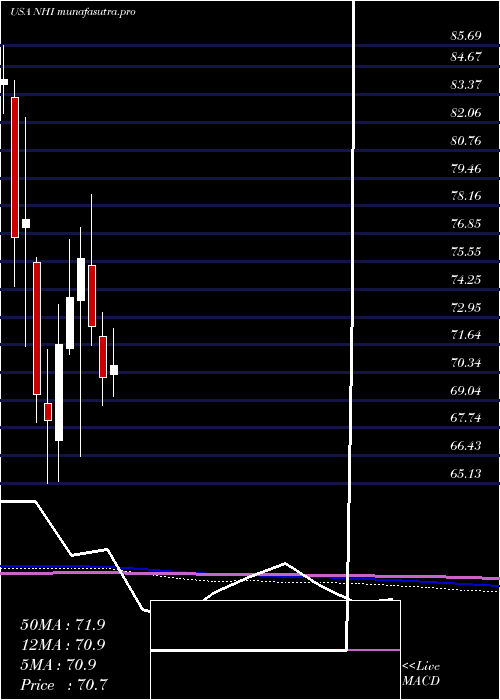
Monthly price and charts NationalHealth Strong monthly Stock price targets for NationalHealth NHI are 78.31 and 80.56 | Monthly Target 1 | 76.56 | | Monthly Target 2 | 77.8 | | Monthly Target 3 | 78.81 | | Monthly Target 4 | 80.05 | | Monthly Target 5 | 81.06 |
Monthly price and volumes National Health
| Date |
Closing |
Open |
Range |
Volume |
Thu 04 December 2025 |
79.04 (-0.55%) |
78.97 |
77.57 - 79.82 |
0.1457 times |
Fri 28 November 2025 |
79.48 (6.67%) |
74.72 |
73.68 - 80.53 |
0.7794 times |
Fri 31 October 2025 |
74.51 (-6.28%) |
80.19 |
71.50 - 80.35 |
0.8962 times |
Tue 30 September 2025 |
79.50 (1.55%) |
77.78 |
76.71 - 80.56 |
1.0327 times |
Fri 29 August 2025 |
78.29 (12.07%) |
70.61 |
69.67 - 78.40 |
1.0659 times |
Thu 31 July 2025 |
69.86 (-0.37%) |
70.25 |
69.18 - 72.39 |
1.1931 times |
Mon 30 June 2025 |
70.12 (-3.3%) |
72.04 |
68.80 - 73.15 |
1.5047 times |
Fri 30 May 2025 |
72.51 (-4.18%) |
75.34 |
71.60 - 78.69 |
1.2356 times |
Wed 30 April 2025 |
75.67 (2.45%) |
73.70 |
66.41 - 77.16 |
1.0129 times |
Mon 31 March 2025 |
73.86 (3.06%) |
71.45 |
71.21 - 76.59 |
1.1339 times |
Fri 28 February 2025 |
71.67 (5.23%) |
67.15 |
65.22 - 73.51 |
0.9303 times |
DMA SMA EMA moving averages of National Health NHI
DMA (daily moving average) of National Health NHI
| DMA period | DMA value | | 5 day DMA | 78.77 | | 12 day DMA | 78.73 | | 20 day DMA | 77.92 | | 35 day DMA | 76.69 | | 50 day DMA | 76.96 | | 100 day DMA | 75.94 | | 150 day DMA | 74.9 | | 200 day DMA | 74.49 | EMA (exponential moving average) of National Health NHI
| EMA period | EMA current | EMA prev | EMA prev2 | | 5 day EMA | 78.83 | 78.72 | 78.65 | | 12 day EMA | 78.49 | 78.39 | 78.31 | | 20 day EMA | 78.05 | 77.95 | 77.85 | | 35 day EMA | 77.73 | 77.65 | 77.58 | | 50 day EMA | 77.27 | 77.2 | 77.13 |
SMA (simple moving average) of National Health NHI
| SMA period | SMA current | SMA prev | SMA prev2 | | 5 day SMA | 78.77 | 78.89 | 79 | | 12 day SMA | 78.73 | 78.64 | 78.49 | | 20 day SMA | 77.92 | 77.77 | 77.58 | | 35 day SMA | 76.69 | 76.53 | 76.35 | | 50 day SMA | 76.96 | 76.95 | 76.96 | | 100 day SMA | 75.94 | 75.86 | 75.77 | | 150 day SMA | 74.9 | 74.87 | 74.85 | | 200 day SMA | 74.49 | 74.43 | 74.38 |
|
|
