NationalGrid NGG full analysis,charts,indicators,moving averages,SMA,DMA,EMA,ADX,MACD,RSINational Grid NGG WideScreen charts, DMA,SMA,EMA technical analysis, forecast prediction, by indicators ADX,MACD,RSI,CCI USA stock exchange
operates under Public Utilities sector & deals in Natural Gas Distribution
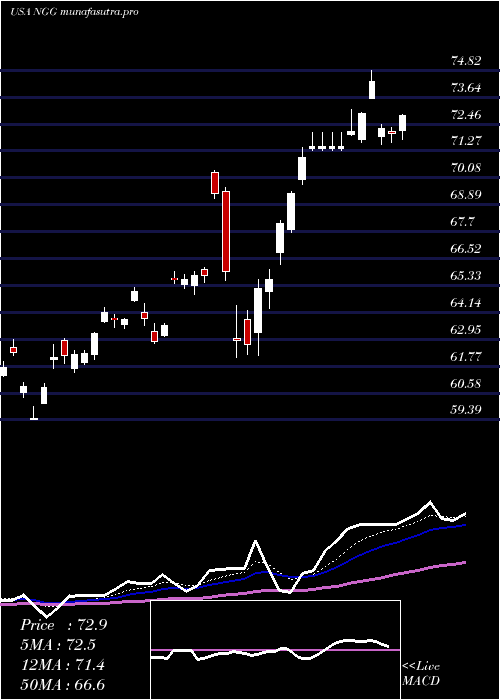
Daily price and charts and targets NationalGrid Strong Daily Stock price targets for NationalGrid NGG are 75.85 and 76.78 | Daily Target 1 | 75.67 | | Daily Target 2 | 76.03 | | Daily Target 3 | 76.6 | | Daily Target 4 | 76.96 | | Daily Target 5 | 77.53 |
Daily price and volume National Grid
| Date |
Closing |
Open |
Range |
Volume |
Tue 21 October 2025 |
76.39 (-0.29%) |
77.10 |
76.24 - 77.17 |
0.7048 times |
Mon 20 October 2025 |
76.61 (-0.44%) |
76.66 |
76.35 - 76.93 |
1.1066 times |
Fri 17 October 2025 |
76.95 (1.38%) |
76.24 |
75.98 - 77.01 |
1.4011 times |
Thu 16 October 2025 |
75.90 (1.16%) |
75.60 |
75.32 - 76.12 |
1.3881 times |
Wed 15 October 2025 |
75.03 (1.05%) |
73.57 |
73.55 - 75.16 |
1.1335 times |
Tue 14 October 2025 |
74.25 (1.3%) |
73.98 |
73.54 - 74.32 |
0.8957 times |
Mon 13 October 2025 |
73.30 (-1.64%) |
73.64 |
73.28 - 73.71 |
0.6351 times |
Fri 10 October 2025 |
74.52 (1.62%) |
73.70 |
73.53 - 74.58 |
1.1817 times |
Thu 09 October 2025 |
73.33 (-0.38%) |
74.14 |
73.24 - 74.20 |
0.8762 times |
Wed 08 October 2025 |
73.61 (-0.37%) |
74.17 |
73.31 - 74.17 |
0.6773 times |
Tue 07 October 2025 |
73.88 (-0.03%) |
73.42 |
73.35 - 74.48 |
1.0784 times |
Weekly price and charts NationalGrid Strong weekly Stock price targets for NationalGrid NGG are 75.85 and 76.78 | Weekly Target 1 | 75.67 | | Weekly Target 2 | 76.03 | | Weekly Target 3 | 76.6 | | Weekly Target 4 | 76.96 | | Weekly Target 5 | 77.53 |
Weekly price and volumes for National Grid
| Date |
Closing |
Open |
Range |
Volume |
Tue 21 October 2025 |
76.39 (-0.73%) |
76.66 |
76.24 - 77.17 |
0.5484 times |
Fri 17 October 2025 |
76.95 (3.26%) |
73.64 |
73.28 - 77.01 |
1.6511 times |
Fri 10 October 2025 |
74.52 (1.48%) |
72.68 |
72.41 - 74.58 |
1.3299 times |
Fri 03 October 2025 |
73.43 (2.63%) |
71.41 |
71.15 - 73.62 |
1.4269 times |
Fri 26 September 2025 |
71.55 (2.08%) |
70.43 |
70.35 - 71.65 |
1.0877 times |
Fri 19 September 2025 |
70.09 (-2.11%) |
71.60 |
69.99 - 71.84 |
0.8418 times |
Fri 12 September 2025 |
71.60 (2.14%) |
69.99 |
69.73 - 71.63 |
1.1493 times |
Fri 05 September 2025 |
70.10 (-0.67%) |
67.63 |
67.51 - 70.13 |
1.0814 times |
Fri 29 August 2025 |
70.57 (0%) |
70.40 |
70.34 - 70.95 |
0.1266 times |
Fri 29 August 2025 |
70.57 (-1.18%) |
71.40 |
70.34 - 71.80 |
0.757 times |
Fri 22 August 2025 |
71.41 (-0.03%) |
71.20 |
70.61 - 72.28 |
1.0091 times |
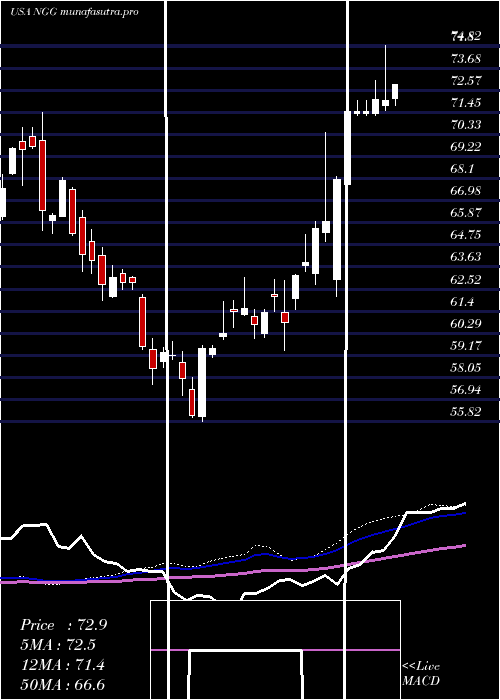
Monthly price and charts NationalGrid Strong monthly Stock price targets for NationalGrid NGG are 74.17 and 79.4 | Monthly Target 1 | 69.94 | | Monthly Target 2 | 73.16 | | Monthly Target 3 | 75.166666666667 | | Monthly Target 4 | 78.39 | | Monthly Target 5 | 80.4 |
Monthly price and volumes National Grid
| Date |
Closing |
Open |
Range |
Volume |
Tue 21 October 2025 |
76.39 (5.12%) |
73.08 |
71.94 - 77.17 |
0.6716 times |
Tue 30 September 2025 |
72.67 (2.98%) |
67.63 |
67.51 - 72.81 |
0.7578 times |
Fri 29 August 2025 |
70.57 (0.26%) |
71.78 |
69.93 - 72.97 |
0.6691 times |
Thu 31 July 2025 |
70.39 (-5.4%) |
74.41 |
69.47 - 74.58 |
1.2681 times |
Mon 30 June 2025 |
74.41 (4.23%) |
71.15 |
70.19 - 74.43 |
1.2559 times |
Fri 30 May 2025 |
71.39 (-2.21%) |
72.25 |
67.09 - 74.81 |
1.4954 times |
Wed 30 April 2025 |
73.00 (11.26%) |
65.31 |
62.13 - 74.82 |
1.2758 times |
Mon 31 March 2025 |
65.61 (5.6%) |
61.34 |
59.39 - 65.93 |
0.6789 times |
Fri 28 February 2025 |
62.13 (1.19%) |
61.23 |
60.01 - 63.09 |
0.6762 times |
Fri 31 January 2025 |
61.40 (3.33%) |
59.66 |
55.82 - 61.95 |
1.2512 times |
Tue 31 December 2024 |
59.42 (-5.43%) |
62.08 |
57.68 - 62.23 |
0.6277 times |

DMA SMA EMA moving averages of National Grid NGG
DMA (daily moving average) of National Grid NGG
| DMA period | DMA value | | 5 day DMA | 76.18 | | 12 day DMA | 74.81 | | 20 day DMA | 73.71 | | 35 day DMA | 72.34 | | 50 day DMA | 71.91 | | 100 day DMA | 71.82 | | 150 day DMA | 71.04 | | 200 day DMA | 68.48 | EMA (exponential moving average) of National Grid NGG
| EMA period | EMA current | EMA prev | EMA prev2 | | 5 day EMA | 76.04 | 75.87 | 75.5 | | 12 day EMA | 74.97 | 74.71 | 74.36 | | 20 day EMA | 74.11 | 73.87 | 73.58 | | 35 day EMA | 73.15 | 72.96 | 72.74 | | 50 day EMA | 72.29 | 72.12 | 71.94 |
SMA (simple moving average) of National Grid NGG
| SMA period | SMA current | SMA prev | SMA prev2 | | 5 day SMA | 76.18 | 75.75 | 75.09 | | 12 day SMA | 74.81 | 74.56 | 74.22 | | 20 day SMA | 73.71 | 73.46 | 73.18 | | 35 day SMA | 72.34 | 72.1 | 71.93 | | 50 day SMA | 71.91 | 71.78 | 71.68 | | 100 day SMA | 71.82 | 71.78 | 71.76 | | 150 day SMA | 71.04 | 70.96 | 70.87 | | 200 day SMA | 68.48 | 68.39 | 68.3 |
|
|
