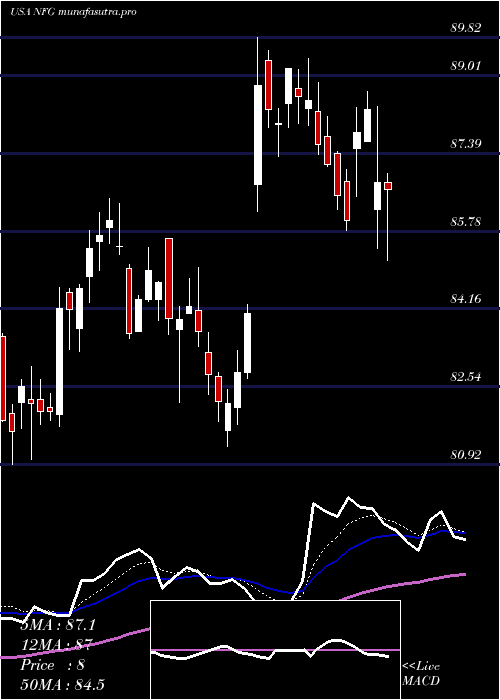
NationalFuel NFG full analysis,charts,indicators,moving averages,SMA,DMA,EMA,ADX,MACD,RSINational Fuel NFG WideScreen charts, DMA,SMA,EMA technical analysis, forecast prediction, by indicators ADX,MACD,RSI,CCI USA stock exchange
operates under Public Utilities sector & deals in Oil Gas Transmission
Daily price and charts and targets NationalFuel Strong Daily Stock price targets for NationalFuel NFG are 81.81 and 83.01 | Daily Target 1 | 80.88 | | Daily Target 2 | 81.54 | | Daily Target 3 | 82.076666666667 | | Daily Target 4 | 82.74 | | Daily Target 5 | 83.28 |
Daily price and volume National Fuel
| Date |
Closing |
Open |
Range |
Volume |
Thu 04 December 2025 |
82.21 (-0.42%) |
81.41 |
81.41 - 82.61 |
1.0051 times |
Wed 03 December 2025 |
82.56 (1.72%) |
81.69 |
81.57 - 82.62 |
1.0242 times |
Tue 02 December 2025 |
81.16 (-1.28%) |
81.75 |
80.93 - 81.98 |
1.5085 times |
Mon 01 December 2025 |
82.21 (-0.29%) |
82.45 |
81.89 - 82.87 |
1.1519 times |
Fri 28 November 2025 |
82.45 (0.98%) |
81.87 |
81.54 - 82.70 |
0.458 times |
Wed 26 November 2025 |
81.65 (1.28%) |
80.59 |
79.99 - 82.14 |
0.9356 times |
Tue 25 November 2025 |
80.62 (1.13%) |
79.65 |
79.50 - 80.88 |
0.9159 times |
Mon 24 November 2025 |
79.72 (-0.51%) |
79.79 |
79.12 - 80.44 |
1.3394 times |
Fri 21 November 2025 |
80.13 (-0.68%) |
80.91 |
80.11 - 81.32 |
0.7941 times |
Thu 20 November 2025 |
80.68 (0.75%) |
80.20 |
80.20 - 81.94 |
0.8674 times |
Wed 19 November 2025 |
80.08 (-1.54%) |
80.84 |
79.84 - 81.69 |
1.0635 times |
Weekly price and charts NationalFuel Strong weekly Stock price targets for NationalFuel NFG are 80.6 and 82.54 | Weekly Target 1 | 80.06 | | Weekly Target 2 | 81.14 | | Weekly Target 3 | 82.003333333333 | | Weekly Target 4 | 83.08 | | Weekly Target 5 | 83.94 |
Weekly price and volumes for National Fuel
| Date |
Closing |
Open |
Range |
Volume |
Thu 04 December 2025 |
82.21 (-0.29%) |
82.45 |
80.93 - 82.87 |
1.0527 times |
Fri 28 November 2025 |
82.45 (2.9%) |
79.79 |
79.12 - 82.70 |
0.8191 times |
Fri 21 November 2025 |
80.13 (-1.11%) |
81.20 |
79.84 - 81.94 |
0.9931 times |
Fri 14 November 2025 |
81.03 (2.12%) |
79.35 |
78.60 - 81.27 |
1.2147 times |
Fri 07 November 2025 |
79.35 (0.56%) |
79.87 |
77.22 - 80.68 |
1.2947 times |
Fri 31 October 2025 |
78.91 (0%) |
79.52 |
78.75 - 79.70 |
0.4658 times |
Fri 31 October 2025 |
78.91 (-3.39%) |
81.65 |
78.41 - 81.65 |
1.6306 times |
Fri 24 October 2025 |
81.68 (-4.69%) |
86.50 |
81.42 - 86.76 |
1.0134 times |
Fri 17 October 2025 |
85.70 (-3.89%) |
84.74 |
83.98 - 87.13 |
1.099 times |
Tue 07 October 2025 |
89.17 (0.69%) |
88.90 |
87.64 - 89.50 |
0.417 times |
Fri 03 October 2025 |
88.56 (-5.51%) |
93.72 |
88.32 - 93.86 |
1.2528 times |

Monthly price and charts NationalFuel Strong monthly Stock price targets for NationalFuel NFG are 80.6 and 82.54 | Monthly Target 1 | 80.06 | | Monthly Target 2 | 81.14 | | Monthly Target 3 | 82.003333333333 | | Monthly Target 4 | 83.08 | | Monthly Target 5 | 83.94 |
Monthly price and volumes National Fuel
| Date |
Closing |
Open |
Range |
Volume |
Thu 04 December 2025 |
82.21 (-0.29%) |
82.45 |
80.93 - 82.87 |
0.216 times |
Fri 28 November 2025 |
82.45 (4.49%) |
79.87 |
77.22 - 82.70 |
0.8866 times |
Fri 31 October 2025 |
78.91 (-14.57%) |
92.17 |
78.41 - 93.80 |
1.0991 times |
Tue 30 September 2025 |
92.37 (6.49%) |
86.38 |
85.00 - 94.13 |
1.013 times |
Fri 29 August 2025 |
86.74 (-0.06%) |
86.79 |
85.00 - 88.59 |
1.0463 times |
Thu 31 July 2025 |
86.79 (2.46%) |
85.62 |
81.29 - 89.82 |
1.4229 times |
Mon 30 June 2025 |
84.71 (2.63%) |
83.03 |
80.92 - 86.45 |
0.8392 times |
Fri 30 May 2025 |
82.54 (7.5%) |
75.99 |
75.99 - 83.40 |
1.0569 times |
Wed 30 April 2025 |
76.78 (-3.04%) |
78.89 |
69.93 - 80.14 |
1.2235 times |
Mon 31 March 2025 |
79.19 (5.31%) |
74.90 |
73.10 - 79.69 |
1.1966 times |
Fri 28 February 2025 |
75.20 (7.38%) |
70.01 |
70.00 - 75.21 |
1.0629 times |

DMA SMA EMA moving averages of National Fuel NFG
DMA (daily moving average) of National Fuel NFG
| DMA period | DMA value | | 5 day DMA | 82.12 | | 12 day DMA | 81.23 | | 20 day DMA | 80.67 | | 35 day DMA | 81.05 | | 50 day DMA | 83.66 | | 100 day DMA | 85.38 | | 150 day DMA | 84.38 | | 200 day DMA | 82.29 | EMA (exponential moving average) of National Fuel NFG
| EMA period | EMA current | EMA prev | EMA prev2 | | 5 day EMA | 81.96 | 81.83 | 81.47 | | 12 day EMA | 81.44 | 81.3 | 81.07 | | 20 day EMA | 81.37 | 81.28 | 81.15 | | 35 day EMA | 82.54 | 82.56 | 82.56 | | 50 day EMA | 83.81 | 83.88 | 83.93 |
SMA (simple moving average) of National Fuel NFG
| SMA period | SMA current | SMA prev | SMA prev2 | | 5 day SMA | 82.12 | 82.01 | 81.62 | | 12 day SMA | 81.23 | 81.09 | 80.97 | | 20 day SMA | 80.67 | 80.53 | 80.42 | | 35 day SMA | 81.05 | 81.17 | 81.22 | | 50 day SMA | 83.66 | 83.75 | 83.85 | | 100 day SMA | 85.38 | 85.38 | 85.38 | | 150 day SMA | 84.38 | 84.35 | 84.32 | | 200 day SMA | 82.29 | 82.24 | 82.19 |
|
|
