NewFortress NFE full analysis,charts,indicators,moving averages,SMA,DMA,EMA,ADX,MACD,RSINew Fortress NFE WideScreen charts, DMA,SMA,EMA technical analysis, forecast prediction, by indicators ADX,MACD,RSI,CCI USA stock exchange
operates under Public Utilities sector & deals in Oil Gas Transmission
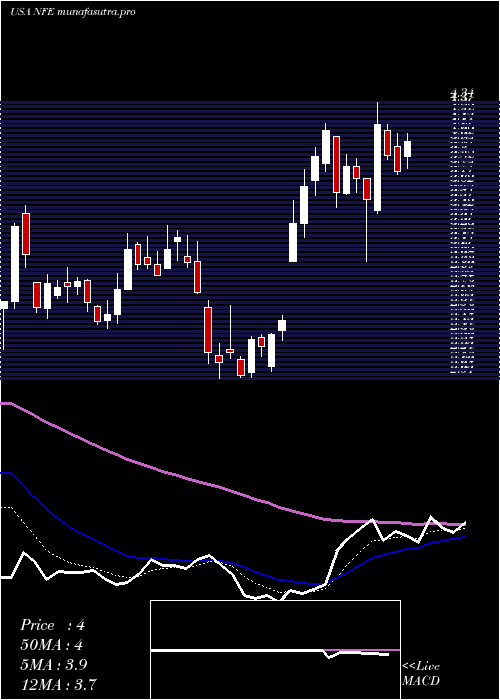
Daily price and charts and targets NewFortress Strong Daily Stock price targets for NewFortress NFE are 1.37 and 1.66 | Daily Target 1 | 1.3 | | Daily Target 2 | 1.43 | | Daily Target 3 | 1.5866666666667 | | Daily Target 4 | 1.72 | | Daily Target 5 | 1.88 |
Daily price and volume New Fortress
| Date |
Closing |
Open |
Range |
Volume |
Fri 05 December 2025 |
1.57 (12.14%) |
1.66 |
1.45 - 1.74 |
1.919 times |
Thu 04 December 2025 |
1.40 (1.45%) |
1.34 |
1.27 - 1.51 |
0.7378 times |
Wed 03 December 2025 |
1.38 (9.52%) |
1.24 |
1.22 - 1.39 |
0.5223 times |
Tue 02 December 2025 |
1.26 (-3.82%) |
1.36 |
1.21 - 1.38 |
0.4939 times |
Mon 01 December 2025 |
1.31 (7.38%) |
1.50 |
1.27 - 1.50 |
2.4037 times |
Fri 28 November 2025 |
1.22 (0%) |
1.18 |
1.14 - 1.23 |
0.3035 times |
Wed 26 November 2025 |
1.22 (9.91%) |
1.12 |
1.06 - 1.22 |
0.475 times |
Tue 25 November 2025 |
1.11 (-8.26%) |
1.19 |
1.08 - 1.23 |
0.5677 times |
Mon 24 November 2025 |
1.21 (0%) |
1.18 |
1.10 - 1.30 |
0.7626 times |
Fri 21 November 2025 |
1.21 (-17.12%) |
1.39 |
1.06 - 1.39 |
1.8144 times |
Thu 20 November 2025 |
1.46 (25.86%) |
1.24 |
1.22 - 1.60 |
2.2048 times |
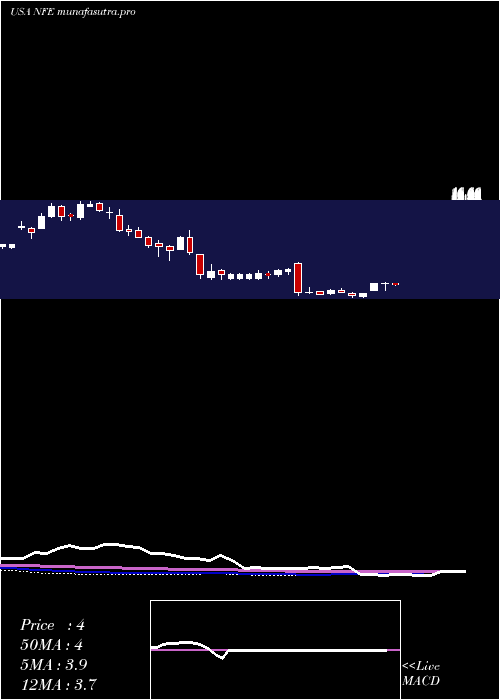
Weekly price and charts NewFortress Strong weekly Stock price targets for NewFortress NFE are 1.39 and 1.92 | Weekly Target 1 | 0.98 | | Weekly Target 2 | 1.27 | | Weekly Target 3 | 1.5066666666667 | | Weekly Target 4 | 1.8 | | Weekly Target 5 | 2.04 |
Weekly price and volumes for New Fortress
| Date |
Closing |
Open |
Range |
Volume |
Fri 05 December 2025 |
1.57 (28.69%) |
1.50 |
1.21 - 1.74 |
1.7153 times |
Fri 28 November 2025 |
1.22 (0.83%) |
1.18 |
1.06 - 1.30 |
0.5953 times |
Fri 21 November 2025 |
1.21 (15.24%) |
1.04 |
0.98 - 1.60 |
1.4949 times |
Fri 14 November 2025 |
1.05 (-21.64%) |
1.37 |
1.03 - 1.42 |
0.7915 times |
Fri 07 November 2025 |
1.34 (3.88%) |
1.55 |
1.28 - 1.78 |
2.2412 times |
Fri 31 October 2025 |
1.29 (0%) |
1.23 |
1.22 - 1.33 |
0.1248 times |
Fri 31 October 2025 |
1.29 (-25%) |
1.75 |
1.22 - 1.75 |
0.7841 times |
Fri 24 October 2025 |
1.72 (-10.42%) |
1.95 |
1.68 - 2.08 |
0.5749 times |
Fri 17 October 2025 |
1.92 (2.67%) |
1.91 |
1.69 - 2.08 |
0.719 times |
Fri 10 October 2025 |
1.87 (-23.67%) |
2.44 |
1.86 - 2.72 |
0.959 times |
Fri 03 October 2025 |
2.45 (16.11%) |
2.10 |
1.97 - 2.50 |
0.9848 times |
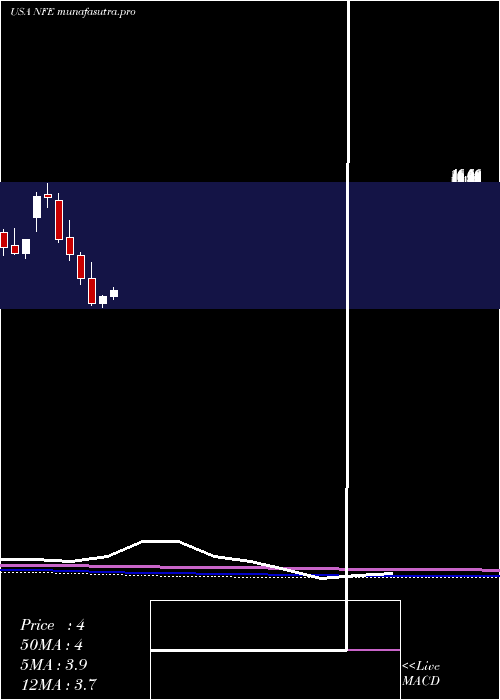
Monthly price and charts NewFortress Strong monthly Stock price targets for NewFortress NFE are 1.39 and 1.92 | Monthly Target 1 | 0.98 | | Monthly Target 2 | 1.27 | | Monthly Target 3 | 1.5066666666667 | | Monthly Target 4 | 1.8 | | Monthly Target 5 | 2.04 |
Monthly price and volumes New Fortress
| Date |
Closing |
Open |
Range |
Volume |
Fri 05 December 2025 |
1.57 (28.69%) |
1.50 |
1.21 - 1.74 |
0.467 times |
Fri 28 November 2025 |
1.22 (-5.43%) |
1.55 |
0.98 - 1.78 |
1.3946 times |
Fri 31 October 2025 |
1.29 (-41.63%) |
2.20 |
1.22 - 2.72 |
1.0165 times |
Tue 30 September 2025 |
2.21 (-10.16%) |
2.40 |
1.26 - 3.08 |
2.3463 times |
Fri 29 August 2025 |
2.46 (-9.89%) |
2.67 |
2.18 - 3.52 |
0.6073 times |
Thu 31 July 2025 |
2.73 (-17.77%) |
3.32 |
2.72 - 4.95 |
0.8831 times |
Mon 30 June 2025 |
3.32 (33.33%) |
2.50 |
2.01 - 3.51 |
0.9487 times |
Fri 30 May 2025 |
2.49 (-54.14%) |
5.51 |
2.26 - 7.37 |
1.167 times |
Wed 30 April 2025 |
5.43 (-34.66%) |
8.20 |
4.72 - 8.57 |
0.678 times |
Mon 31 March 2025 |
8.31 (-16.9%) |
10.30 |
7.58 - 12.31 |
0.4914 times |
Fri 28 February 2025 |
10.00 (-33.33%) |
14.60 |
9.66 - 15.46 |
0.3254 times |
DMA SMA EMA moving averages of New Fortress NFE
DMA (daily moving average) of New Fortress NFE
| DMA period | DMA value | | 5 day DMA | 1.38 | | 12 day DMA | 1.29 | | 20 day DMA | 1.24 | | 35 day DMA | 1.38 | | 50 day DMA | 1.6 | | 100 day DMA | 2.13 | | 150 day DMA | 2.62 | | 200 day DMA | 3.94 | EMA (exponential moving average) of New Fortress NFE
| EMA period | EMA current | EMA prev | EMA prev2 | | 5 day EMA | 1.41 | 1.33 | 1.29 | | 12 day EMA | 1.32 | 1.27 | 1.25 | | 20 day EMA | 1.34 | 1.32 | 1.31 | | 35 day EMA | 1.48 | 1.47 | 1.47 | | 50 day EMA | 1.65 | 1.65 | 1.66 |
SMA (simple moving average) of New Fortress NFE
| SMA period | SMA current | SMA prev | SMA prev2 | | 5 day SMA | 1.38 | 1.31 | 1.28 | | 12 day SMA | 1.29 | 1.26 | 1.23 | | 20 day SMA | 1.24 | 1.23 | 1.24 | | 35 day SMA | 1.38 | 1.39 | 1.4 | | 50 day SMA | 1.6 | 1.62 | 1.64 | | 100 day SMA | 2.13 | 2.16 | 2.18 | | 150 day SMA | 2.62 | 2.65 | 2.68 | | 200 day SMA | 3.94 | 4 | 4.05 |
|
|
