NorthfieldBancorp NFBK full analysis,charts,indicators,moving averages,SMA,DMA,EMA,ADX,MACD,RSINorthfield Bancorp NFBK WideScreen charts, DMA,SMA,EMA technical analysis, forecast prediction, by indicators ADX,MACD,RSI,CCI USA stock exchange
operates under Finance sector & deals in Savings Institutions
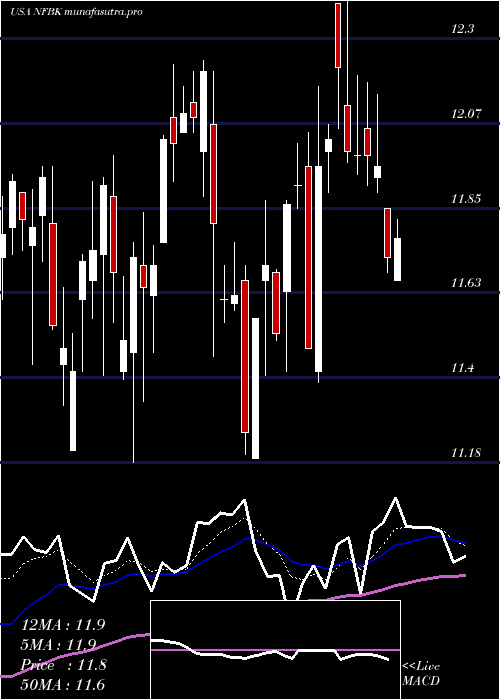
Daily price and charts and targets NorthfieldBancorp Strong Daily Stock price targets for NorthfieldBancorp NFBK are 10.77 and 11.12 | Daily Target 1 | 10.71 | | Daily Target 2 | 10.83 | | Daily Target 3 | 11.056666666667 | | Daily Target 4 | 11.18 | | Daily Target 5 | 11.41 |
Daily price and volume Northfield Bancorp
| Date |
Closing |
Open |
Range |
Volume |
Tue 29 July 2025 |
10.96 (-0.36%) |
11.07 |
10.93 - 11.28 |
1.0848 times |
Mon 28 July 2025 |
11.00 (1.1%) |
10.92 |
10.81 - 11.08 |
1.305 times |
Fri 25 July 2025 |
10.88 (-4.31%) |
11.35 |
10.84 - 11.37 |
1.7176 times |
Thu 24 July 2025 |
11.37 (0.09%) |
11.28 |
11.22 - 11.57 |
1.1171 times |
Wed 23 July 2025 |
11.36 (0.35%) |
11.37 |
11.26 - 11.37 |
0.7807 times |
Tue 22 July 2025 |
11.32 (-0.53%) |
11.35 |
11.30 - 11.55 |
0.7395 times |
Mon 21 July 2025 |
11.38 (0%) |
11.42 |
11.37 - 11.54 |
0.6978 times |
Fri 18 July 2025 |
11.38 (-0.87%) |
11.57 |
11.37 - 11.57 |
0.5775 times |
Thu 17 July 2025 |
11.48 (0.88%) |
11.36 |
11.21 - 11.57 |
1.1337 times |
Wed 16 July 2025 |
11.38 (0.35%) |
11.44 |
11.18 - 11.44 |
0.8463 times |
Tue 15 July 2025 |
11.34 (-3.65%) |
11.74 |
11.34 - 11.78 |
0.9886 times |
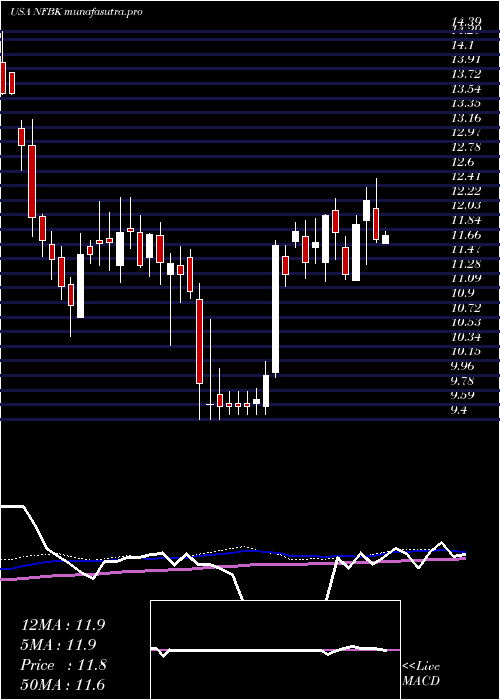
Weekly price and charts NorthfieldBancorp Strong weekly Stock price targets for NorthfieldBancorp NFBK are 10.89 and 11.36 | Weekly Target 1 | 10.55 | | Weekly Target 2 | 10.75 | | Weekly Target 3 | 11.016666666667 | | Weekly Target 4 | 11.22 | | Weekly Target 5 | 11.49 |
Weekly price and volumes for Northfield Bancorp
| Date |
Closing |
Open |
Range |
Volume |
Tue 29 July 2025 |
10.96 (0.74%) |
10.92 |
10.81 - 11.28 |
0.5299 times |
Fri 25 July 2025 |
10.88 (-4.39%) |
11.42 |
10.84 - 11.57 |
1.1204 times |
Fri 18 July 2025 |
11.38 (-2.9%) |
11.66 |
11.18 - 11.82 |
0.9489 times |
Fri 11 July 2025 |
11.72 (-4.09%) |
12.12 |
11.68 - 12.50 |
0.9604 times |
Thu 03 July 2025 |
12.22 (2.6%) |
11.96 |
11.39 - 12.39 |
0.6896 times |
Fri 27 June 2025 |
11.91 (5.77%) |
11.19 |
11.19 - 12.02 |
1.7507 times |
Fri 20 June 2025 |
11.26 (-4.66%) |
11.61 |
11.20 - 11.76 |
0.9342 times |
Fri 13 June 2025 |
11.81 (-1.83%) |
12.09 |
11.46 - 12.24 |
1.045 times |
Fri 06 June 2025 |
12.03 (3%) |
11.42 |
11.18 - 12.04 |
0.998 times |
Fri 30 May 2025 |
11.68 (2.28%) |
11.61 |
11.41 - 11.99 |
1.0228 times |
Fri 23 May 2025 |
11.42 (-3.38%) |
11.75 |
11.21 - 11.96 |
1.0259 times |
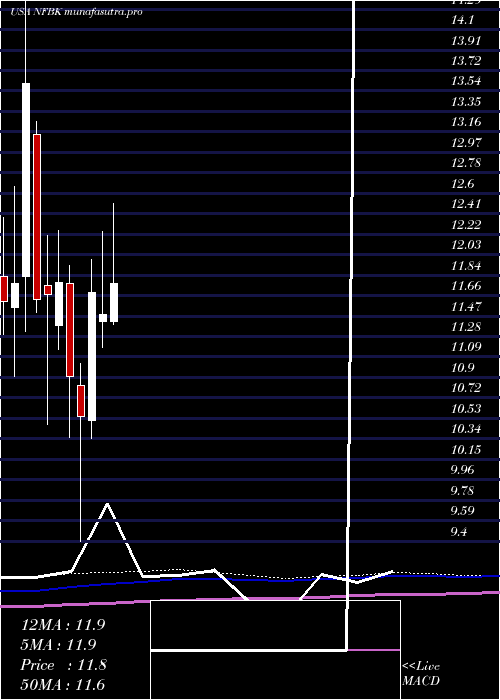
Monthly price and charts NorthfieldBancorp Strong monthly Stock price targets for NorthfieldBancorp NFBK are 10.04 and 11.73 | Monthly Target 1 | 9.73 | | Monthly Target 2 | 10.35 | | Monthly Target 3 | 11.423333333333 | | Monthly Target 4 | 12.04 | | Monthly Target 5 | 13.11 |
Monthly price and volumes Northfield Bancorp
| Date |
Closing |
Open |
Range |
Volume |
Tue 29 July 2025 |
10.96 (-4.53%) |
11.42 |
10.81 - 12.50 |
0.9192 times |
Mon 30 June 2025 |
11.48 (-1.71%) |
11.42 |
11.18 - 12.24 |
1.1469 times |
Fri 30 May 2025 |
11.68 (10.71%) |
10.51 |
10.34 - 11.99 |
1.0062 times |
Wed 30 April 2025 |
10.55 (-3.3%) |
10.83 |
9.40 - 11.03 |
1.0462 times |
Mon 31 March 2025 |
10.91 (-7.39%) |
11.77 |
10.35 - 11.93 |
0.9626 times |
Fri 28 February 2025 |
11.78 (0.94%) |
11.38 |
11.16 - 12.25 |
0.9705 times |
Fri 31 January 2025 |
11.67 (0.43%) |
11.75 |
10.47 - 12.21 |
1.0648 times |
Tue 31 December 2024 |
11.62 (-14.56%) |
13.14 |
11.50 - 13.26 |
1.0448 times |
Tue 26 November 2024 |
13.60 (15.55%) |
11.83 |
11.33 - 14.39 |
0.9742 times |
Thu 31 October 2024 |
11.77 (1.47%) |
11.55 |
10.91 - 12.66 |
0.8646 times |
Mon 30 September 2024 |
11.60 (-4.29%) |
11.92 |
11.16 - 12.37 |
1.1009 times |
DMA SMA EMA moving averages of Northfield Bancorp NFBK
DMA (daily moving average) of Northfield Bancorp NFBK
| DMA period | DMA value | | 5 day DMA | 11.11 | | 12 day DMA | 11.3 | | 20 day DMA | 11.57 | | 35 day DMA | 11.66 | | 50 day DMA | 11.68 | | 100 day DMA | 11.17 | | 150 day DMA | 11.32 | | 200 day DMA | 11.61 | EMA (exponential moving average) of Northfield Bancorp NFBK
| EMA period | EMA current | EMA prev | EMA prev2 | | 5 day EMA | 11.08 | 11.14 | 11.21 | | 12 day EMA | 11.29 | 11.35 | 11.41 | | 20 day EMA | 11.42 | 11.47 | 11.52 | | 35 day EMA | 11.54 | 11.57 | 11.6 | | 50 day EMA | 11.61 | 11.64 | 11.67 |
SMA (simple moving average) of Northfield Bancorp NFBK
| SMA period | SMA current | SMA prev | SMA prev2 | | 5 day SMA | 11.11 | 11.19 | 11.26 | | 12 day SMA | 11.3 | 11.37 | 11.45 | | 20 day SMA | 11.57 | 11.6 | 11.65 | | 35 day SMA | 11.66 | 11.69 | 11.7 | | 50 day SMA | 11.68 | 11.69 | 11.71 | | 100 day SMA | 11.17 | 11.17 | 11.18 | | 150 day SMA | 11.32 | 11.33 | 11.33 | | 200 day SMA | 11.61 | 11.61 | 11.61 |
|
|
