NextdecadeCorporation NEXT full analysis,charts,indicators,moving averages,SMA,DMA,EMA,ADX,MACD,RSINextdecade Corporation NEXT WideScreen charts, DMA,SMA,EMA technical analysis, forecast prediction, by indicators ADX,MACD,RSI,CCI USA stock exchange
operates under Public Utilities sector & deals in Oil Gas Production
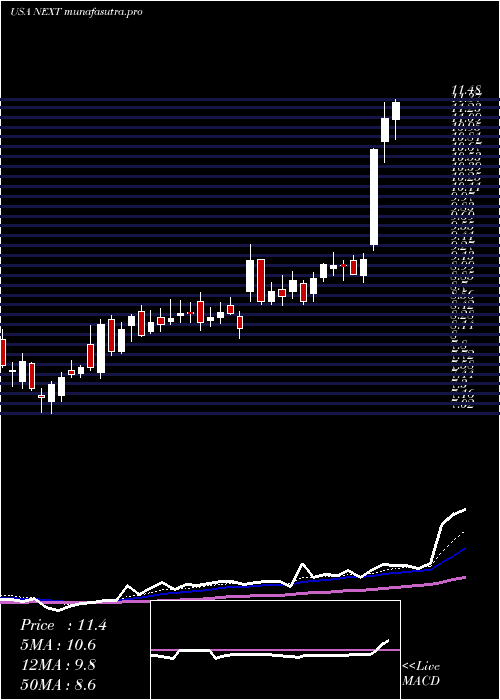
Daily price and charts and targets NextdecadeCorporation Strong Daily Stock price targets for NextdecadeCorporation NEXT are 6.12 and 6.37 | Daily Target 1 | 5.92 | | Daily Target 2 | 6.07 | | Daily Target 3 | 6.17 | | Daily Target 4 | 6.32 | | Daily Target 5 | 6.42 |
Daily price and volume Nextdecade Corporation
| Date |
Closing |
Open |
Range |
Volume |
Thu 04 December 2025 |
6.22 (1.63%) |
6.12 |
6.02 - 6.27 |
0.8337 times |
Wed 03 December 2025 |
6.12 (4.97%) |
5.85 |
5.83 - 6.16 |
1.0892 times |
Tue 02 December 2025 |
5.83 (-2.35%) |
6.02 |
5.82 - 6.08 |
0.75 times |
Mon 01 December 2025 |
5.97 (-2.29%) |
6.10 |
5.95 - 6.16 |
0.8579 times |
Fri 28 November 2025 |
6.11 (1.83%) |
6.04 |
5.93 - 6.22 |
0.8785 times |
Wed 26 November 2025 |
6.00 (3.09%) |
5.87 |
5.84 - 6.04 |
1.0011 times |
Tue 25 November 2025 |
5.82 (4.11%) |
5.63 |
5.58 - 5.84 |
0.7096 times |
Mon 24 November 2025 |
5.59 (-2.1%) |
5.76 |
5.46 - 5.87 |
1.1547 times |
Fri 21 November 2025 |
5.71 (-1.55%) |
5.74 |
5.57 - 5.85 |
1.4598 times |
Thu 20 November 2025 |
5.80 (-3.49%) |
6.17 |
5.80 - 6.36 |
1.2655 times |
Wed 19 November 2025 |
6.01 (0.5%) |
5.95 |
5.83 - 6.16 |
1.0568 times |
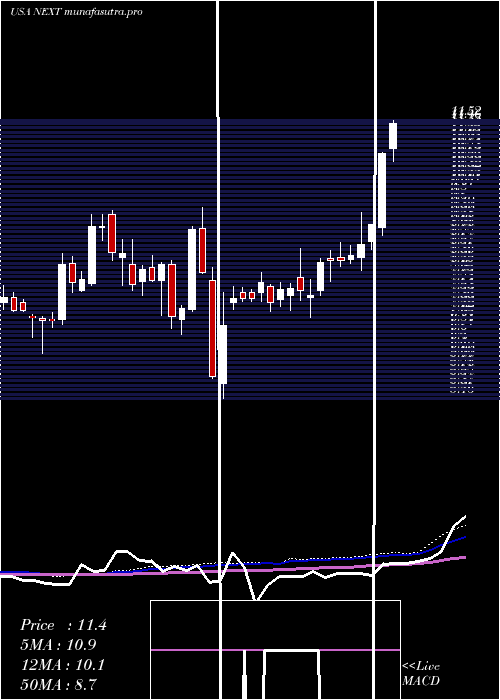
Weekly price and charts NextdecadeCorporation Strong weekly Stock price targets for NextdecadeCorporation NEXT are 6.02 and 6.47 | Weekly Target 1 | 5.65 | | Weekly Target 2 | 5.94 | | Weekly Target 3 | 6.1033333333333 | | Weekly Target 4 | 6.39 | | Weekly Target 5 | 6.55 |
Weekly price and volumes for Nextdecade Corporation
| Date |
Closing |
Open |
Range |
Volume |
Thu 04 December 2025 |
6.22 (1.8%) |
6.10 |
5.82 - 6.27 |
0.6288 times |
Fri 28 November 2025 |
6.11 (7.01%) |
5.76 |
5.46 - 6.22 |
0.6668 times |
Fri 21 November 2025 |
5.71 (-5.78%) |
6.05 |
5.57 - 6.36 |
1.0957 times |
Fri 14 November 2025 |
6.06 (2.36%) |
5.96 |
5.70 - 6.27 |
1.1211 times |
Fri 07 November 2025 |
5.92 (-0.17%) |
5.79 |
5.68 - 6.11 |
0.6413 times |
Fri 31 October 2025 |
5.93 (0%) |
5.76 |
5.68 - 6.04 |
0.1796 times |
Fri 31 October 2025 |
5.93 (1.72%) |
5.83 |
5.68 - 6.20 |
0.9569 times |
Fri 24 October 2025 |
5.83 (-5.97%) |
6.19 |
5.76 - 6.48 |
0.9689 times |
Fri 17 October 2025 |
6.20 (-4.02%) |
6.52 |
5.71 - 6.78 |
1.7856 times |
Fri 10 October 2025 |
6.46 (-9.27%) |
7.09 |
6.45 - 7.47 |
1.9554 times |
Fri 03 October 2025 |
7.12 (1.14%) |
7.03 |
6.40 - 7.17 |
1.2342 times |
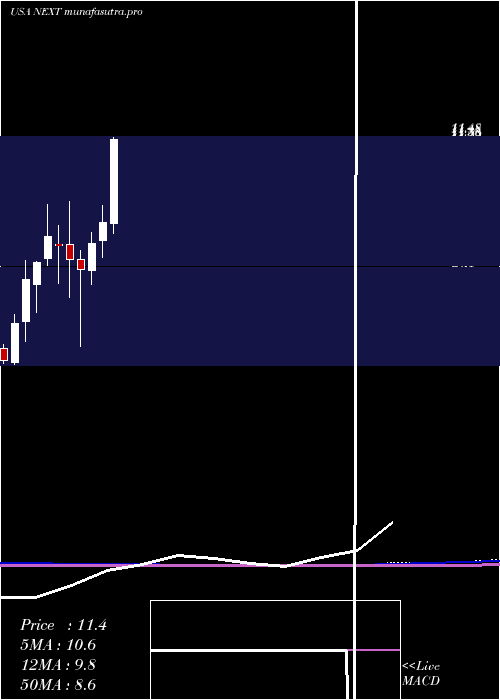
Monthly price and charts NextdecadeCorporation Strong monthly Stock price targets for NextdecadeCorporation NEXT are 6.02 and 6.47 | Monthly Target 1 | 5.65 | | Monthly Target 2 | 5.94 | | Monthly Target 3 | 6.1033333333333 | | Monthly Target 4 | 6.39 | | Monthly Target 5 | 6.55 |
Monthly price and volumes Nextdecade Corporation
| Date |
Closing |
Open |
Range |
Volume |
Thu 04 December 2025 |
6.22 (1.8%) |
6.10 |
5.82 - 6.27 |
0.1585 times |
Fri 28 November 2025 |
6.11 (3.04%) |
5.79 |
5.46 - 6.36 |
0.8884 times |
Fri 31 October 2025 |
5.93 (-12.67%) |
6.73 |
5.68 - 7.47 |
1.6745 times |
Tue 30 September 2025 |
6.79 (-36.66%) |
10.93 |
6.37 - 11.27 |
2.1258 times |
Fri 29 August 2025 |
10.72 (-5.63%) |
11.10 |
9.34 - 11.35 |
1.0162 times |
Thu 31 July 2025 |
11.36 (27.5%) |
8.87 |
8.57 - 12.12 |
1.1592 times |
Mon 30 June 2025 |
8.91 (7.61%) |
8.36 |
7.85 - 9.42 |
0.9044 times |
Fri 30 May 2025 |
8.28 (10.7%) |
7.45 |
7.02 - 8.60 |
0.6378 times |
Wed 30 April 2025 |
7.48 (-3.86%) |
7.78 |
5.16 - 8.05 |
0.8258 times |
Mon 31 March 2025 |
7.78 (-5.35%) |
8.24 |
6.62 - 9.54 |
0.6093 times |
Fri 28 February 2025 |
8.22 (-3.07%) |
8.24 |
7.07 - 8.81 |
0.4752 times |
DMA SMA EMA moving averages of Nextdecade Corporation NEXT
DMA (daily moving average) of Nextdecade Corporation NEXT
| DMA period | DMA value | | 5 day DMA | 6.05 | | 12 day DMA | 5.93 | | 20 day DMA | 5.94 | | 35 day DMA | 5.96 | | 50 day DMA | 6.2 | | 100 day DMA | 8.04 | | 150 day DMA | 8.14 | | 200 day DMA | 7.99 | EMA (exponential moving average) of Nextdecade Corporation NEXT
| EMA period | EMA current | EMA prev | EMA prev2 | | 5 day EMA | 6.06 | 5.98 | 5.91 | | 12 day EMA | 5.98 | 5.94 | 5.91 | | 20 day EMA | 5.99 | 5.97 | 5.95 | | 35 day EMA | 6.09 | 6.08 | 6.08 | | 50 day EMA | 6.23 | 6.23 | 6.23 |
SMA (simple moving average) of Nextdecade Corporation NEXT
| SMA period | SMA current | SMA prev | SMA prev2 | | 5 day SMA | 6.05 | 6.01 | 5.95 | | 12 day SMA | 5.93 | 5.9 | 5.89 | | 20 day SMA | 5.94 | 5.93 | 5.92 | | 35 day SMA | 5.96 | 5.96 | 5.96 | | 50 day SMA | 6.2 | 6.21 | 6.23 | | 100 day SMA | 8.04 | 8.09 | 8.14 | | 150 day SMA | 8.14 | 8.15 | 8.16 | | 200 day SMA | 7.99 | 8 | 8.01 |
|
|
