NeonodeInc NEON full analysis,charts,indicators,moving averages,SMA,DMA,EMA,ADX,MACD,RSINeonode Inc NEON WideScreen charts, DMA,SMA,EMA technical analysis, forecast prediction, by indicators ADX,MACD,RSI,CCI USA stock exchange
operates under Capital Goods sector & deals in Industrial Machinery Components
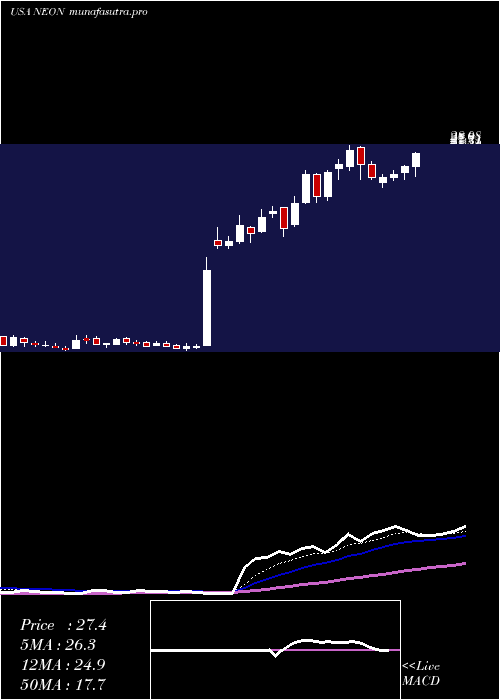
Daily price and charts and targets NeonodeInc Strong Daily Stock price targets for NeonodeInc NEON are 2.36 and 2.59 | Daily Target 1 | 2.17 | | Daily Target 2 | 2.32 | | Daily Target 3 | 2.4033333333333 | | Daily Target 4 | 2.55 | | Daily Target 5 | 2.63 |
Daily price and volume Neonode Inc
| Date |
Closing |
Open |
Range |
Volume |
Thu 04 December 2025 |
2.46 (5.58%) |
2.32 |
2.26 - 2.49 |
0.8669 times |
Wed 03 December 2025 |
2.33 (5.91%) |
2.19 |
2.17 - 2.35 |
0.9172 times |
Tue 02 December 2025 |
2.20 (2.33%) |
2.12 |
2.09 - 2.29 |
0.5368 times |
Mon 01 December 2025 |
2.15 (-3.59%) |
2.21 |
2.12 - 2.21 |
0.8089 times |
Fri 28 November 2025 |
2.23 (-1.33%) |
2.26 |
2.22 - 2.33 |
0.5641 times |
Wed 26 November 2025 |
2.26 (7.62%) |
2.10 |
2.10 - 2.30 |
2.1358 times |
Tue 25 November 2025 |
2.10 (1.45%) |
2.06 |
2.00 - 2.13 |
0.7034 times |
Mon 24 November 2025 |
2.07 (3.5%) |
2.01 |
2.00 - 2.09 |
0.7846 times |
Fri 21 November 2025 |
2.00 (1.52%) |
1.96 |
1.91 - 2.02 |
1.0633 times |
Thu 20 November 2025 |
1.97 (-2.48%) |
2.02 |
1.93 - 2.21 |
1.6191 times |
Wed 19 November 2025 |
2.02 (-4.72%) |
2.13 |
2.00 - 2.20 |
0.9232 times |
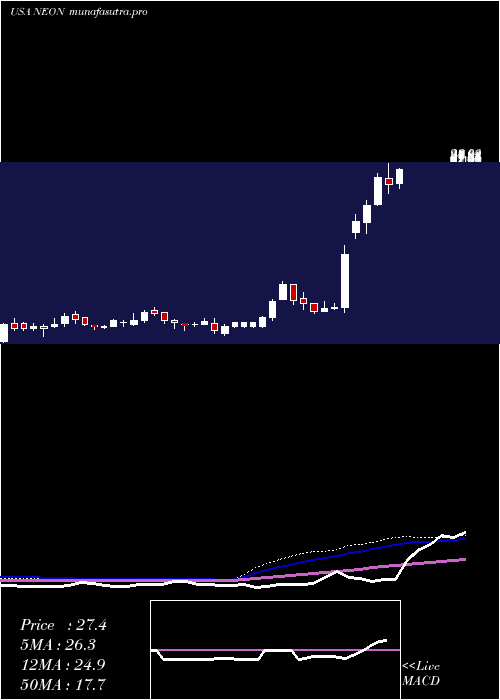
Weekly price and charts NeonodeInc Strong weekly Stock price targets for NeonodeInc NEON are 2.28 and 2.68 | Weekly Target 1 | 1.95 | | Weekly Target 2 | 2.2 | | Weekly Target 3 | 2.3466666666667 | | Weekly Target 4 | 2.6 | | Weekly Target 5 | 2.75 |
Weekly price and volumes for Neonode Inc
| Date |
Closing |
Open |
Range |
Volume |
Thu 04 December 2025 |
2.46 (10.31%) |
2.21 |
2.09 - 2.49 |
0.5893 times |
Fri 28 November 2025 |
2.23 (11.5%) |
2.01 |
2.00 - 2.33 |
0.7885 times |
Fri 21 November 2025 |
2.00 (-8.26%) |
2.17 |
1.91 - 2.21 |
1.0256 times |
Fri 14 November 2025 |
2.18 (-7.23%) |
2.38 |
2.14 - 2.46 |
0.8497 times |
Fri 07 November 2025 |
2.35 (-22.7%) |
2.80 |
2.20 - 2.89 |
1.2705 times |
Fri 31 October 2025 |
3.04 (0%) |
3.02 |
3.02 - 3.11 |
0.1387 times |
Fri 31 October 2025 |
3.04 (-7.6%) |
3.31 |
3.02 - 3.35 |
0.9027 times |
Fri 24 October 2025 |
3.29 (-2.08%) |
3.36 |
3.12 - 3.45 |
1.1846 times |
Fri 17 October 2025 |
3.36 (-4.82%) |
3.53 |
3.27 - 3.70 |
1.241 times |
Fri 10 October 2025 |
3.53 (-6.37%) |
3.78 |
3.52 - 3.94 |
2.0095 times |
Fri 03 October 2025 |
3.77 (4.72%) |
3.60 |
3.24 - 3.81 |
3.4318 times |
Monthly price and charts NeonodeInc Strong monthly Stock price targets for NeonodeInc NEON are 2.28 and 2.68 | Monthly Target 1 | 1.95 | | Monthly Target 2 | 2.2 | | Monthly Target 3 | 2.3466666666667 | | Monthly Target 4 | 2.6 | | Monthly Target 5 | 2.75 |
Monthly price and volumes Neonode Inc
| Date |
Closing |
Open |
Range |
Volume |
Thu 04 December 2025 |
2.46 (10.31%) |
2.21 |
2.09 - 2.49 |
0.0462 times |
Fri 28 November 2025 |
2.23 (-26.64%) |
2.80 |
1.91 - 2.89 |
0.3083 times |
Fri 31 October 2025 |
3.04 (-12.89%) |
3.46 |
3.02 - 3.94 |
0.5679 times |
Tue 30 September 2025 |
3.49 (-85.43%) |
23.51 |
3.24 - 24.12 |
7.4637 times |
Fri 29 August 2025 |
23.95 (18.74%) |
20.17 |
20.02 - 26.95 |
0.312 times |
Thu 31 July 2025 |
20.17 (-20.9%) |
25.50 |
20.06 - 29.90 |
0.4169 times |
Mon 30 June 2025 |
25.50 (149.51%) |
10.20 |
9.65 - 25.85 |
0.575 times |
Fri 30 May 2025 |
10.22 (-16.57%) |
12.26 |
9.62 - 13.20 |
0.1131 times |
Wed 30 April 2025 |
12.25 (50.49%) |
8.14 |
6.80 - 13.50 |
0.1318 times |
Mon 31 March 2025 |
8.14 (-6%) |
8.66 |
7.52 - 8.91 |
0.0651 times |
Fri 28 February 2025 |
8.66 (1.76%) |
8.24 |
8.07 - 10.25 |
0.1026 times |
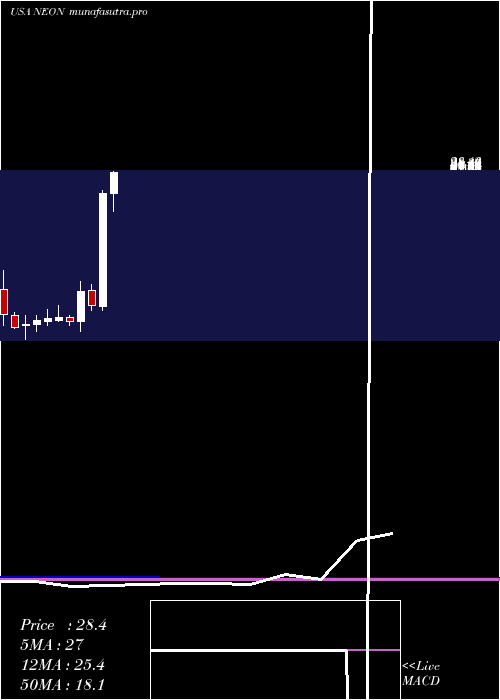
DMA SMA EMA moving averages of Neonode Inc NEON
DMA (daily moving average) of Neonode Inc NEON
| DMA period | DMA value | | 5 day DMA | 2.27 | | 12 day DMA | 2.16 | | 20 day DMA | 2.21 | | 35 day DMA | 2.62 | | 50 day DMA | 2.93 | | 100 day DMA | 10.56 | | 150 day DMA | 12.3 | | 200 day DMA | 11.4 | EMA (exponential moving average) of Neonode Inc NEON
| EMA period | EMA current | EMA prev | EMA prev2 | | 5 day EMA | 2.3 | 2.22 | 2.17 | | 12 day EMA | 2.26 | 2.22 | 2.2 | | 20 day EMA | 2.35 | 2.34 | 2.34 | | 35 day EMA | 2.62 | 2.63 | 2.65 | | 50 day EMA | 2.96 | 2.98 | 3.01 |
SMA (simple moving average) of Neonode Inc NEON
| SMA period | SMA current | SMA prev | SMA prev2 | | 5 day SMA | 2.27 | 2.23 | 2.19 | | 12 day SMA | 2.16 | 2.13 | 2.12 | | 20 day SMA | 2.21 | 2.22 | 2.25 | | 35 day SMA | 2.62 | 2.66 | 2.69 | | 50 day SMA | 2.93 | 2.96 | 2.99 | | 100 day SMA | 10.56 | 10.81 | 11.05 | | 150 day SMA | 12.3 | 12.37 | 12.43 | | 200 day SMA | 11.4 | 11.44 | 11.47 |
|
|
