NexteraEnergy NEE full analysis,charts,indicators,moving averages,SMA,DMA,EMA,ADX,MACD,RSINextera Energy NEE WideScreen charts, DMA,SMA,EMA technical analysis, forecast prediction, by indicators ADX,MACD,RSI,CCI USA stock exchange
operates under Public Utilities sector & deals in Electric Utilities Central
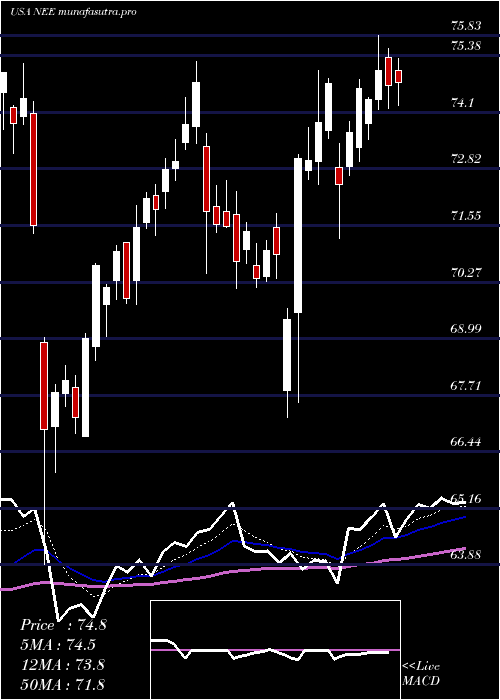
Daily price and charts and targets NexteraEnergy Strong Daily Stock price targets for NexteraEnergy NEE are 84.03 and 85.06 | Daily Target 1 | 83.78 | | Daily Target 2 | 84.27 | | Daily Target 3 | 84.806666666667 | | Daily Target 4 | 85.3 | | Daily Target 5 | 85.84 |
Daily price and volume Nextera Energy
| Date |
Closing |
Open |
Range |
Volume |
Mon 20 October 2025 |
84.77 (0.28%) |
85.19 |
84.31 - 85.34 |
0.5617 times |
Fri 17 October 2025 |
84.53 (-0.61%) |
85.45 |
84.17 - 85.82 |
0.9827 times |
Thu 16 October 2025 |
85.05 (-0.86%) |
86.22 |
84.97 - 86.74 |
0.8958 times |
Wed 15 October 2025 |
85.79 (1.36%) |
85.07 |
84.83 - 86.49 |
0.9963 times |
Tue 14 October 2025 |
84.64 (0.4%) |
84.17 |
83.43 - 84.84 |
0.9581 times |
Mon 13 October 2025 |
84.30 (1.31%) |
83.13 |
83.01 - 85.03 |
0.9055 times |
Tue 07 October 2025 |
83.21 (0.87%) |
83.13 |
82.41 - 84.61 |
1.7316 times |
Mon 06 October 2025 |
82.49 (2.73%) |
80.46 |
79.39 - 82.49 |
1.2336 times |
Fri 03 October 2025 |
80.30 (2.29%) |
78.46 |
77.65 - 81.37 |
0.9778 times |
Thu 02 October 2025 |
78.50 (-0.22%) |
78.66 |
77.54 - 78.90 |
0.757 times |
Wed 01 October 2025 |
78.67 (4.21%) |
76.32 |
76.22 - 78.70 |
1.6171 times |
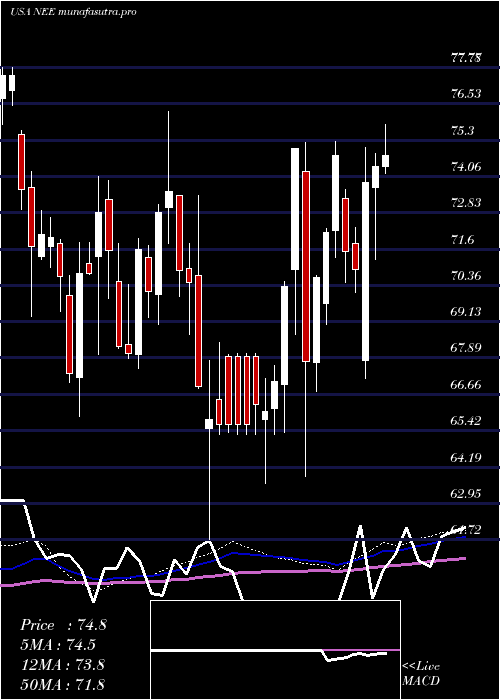
Weekly price and charts NexteraEnergy Strong weekly Stock price targets for NexteraEnergy NEE are 84.03 and 85.06 | Weekly Target 1 | 83.78 | | Weekly Target 2 | 84.27 | | Weekly Target 3 | 84.806666666667 | | Weekly Target 4 | 85.3 | | Weekly Target 5 | 85.84 |
Weekly price and volumes for Nextera Energy
| Date |
Closing |
Open |
Range |
Volume |
Mon 20 October 2025 |
84.77 (0.28%) |
85.19 |
84.31 - 85.34 |
0.1396 times |
Fri 17 October 2025 |
84.53 (1.59%) |
83.13 |
83.01 - 86.74 |
1.1773 times |
Tue 07 October 2025 |
83.21 (3.62%) |
80.46 |
79.39 - 84.61 |
0.7367 times |
Fri 03 October 2025 |
80.30 (5.87%) |
75.68 |
75.12 - 81.37 |
1.3605 times |
Fri 26 September 2025 |
75.85 (6.71%) |
71.40 |
71.27 - 75.86 |
1.3385 times |
Fri 19 September 2025 |
71.08 (-0.78%) |
71.58 |
69.37 - 72.20 |
1.4003 times |
Fri 12 September 2025 |
71.64 (1.04%) |
70.83 |
69.24 - 72.49 |
1.226 times |
Fri 05 September 2025 |
70.90 (-1.6%) |
72.27 |
70.16 - 72.66 |
1.0962 times |
Fri 29 August 2025 |
72.05 (0%) |
72.40 |
71.82 - 72.83 |
0.3013 times |
Fri 29 August 2025 |
72.05 (-5.59%) |
75.81 |
71.82 - 76.20 |
1.2236 times |
Fri 22 August 2025 |
76.32 (1.21%) |
76.11 |
75.31 - 77.42 |
1.426 times |
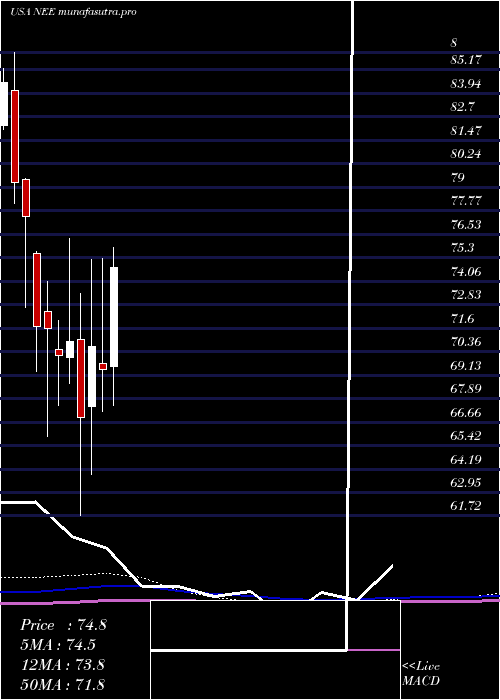
Monthly price and charts NexteraEnergy Strong monthly Stock price targets for NexteraEnergy NEE are 80.5 and 91.02 | Monthly Target 1 | 72.06 | | Monthly Target 2 | 78.41 | | Monthly Target 3 | 82.576666666667 | | Monthly Target 4 | 88.93 | | Monthly Target 5 | 93.1 |
Monthly price and volumes Nextera Energy
| Date |
Closing |
Open |
Range |
Volume |
Mon 20 October 2025 |
84.77 (12.29%) |
76.32 |
76.22 - 86.74 |
0.4865 times |
Tue 30 September 2025 |
75.49 (4.77%) |
72.27 |
69.24 - 76.70 |
0.9421 times |
Fri 29 August 2025 |
72.05 (1.39%) |
71.43 |
70.34 - 77.42 |
0.9022 times |
Thu 31 July 2025 |
71.06 (2.36%) |
69.57 |
67.54 - 78.46 |
1.0407 times |
Mon 30 June 2025 |
69.42 (-1.73%) |
69.75 |
67.20 - 75.25 |
0.962 times |
Fri 30 May 2025 |
70.64 (5.62%) |
67.49 |
63.88 - 75.21 |
1.4085 times |
Wed 30 April 2025 |
66.88 (-5.66%) |
71.00 |
61.72 - 73.42 |
1.0938 times |
Mon 31 March 2025 |
70.89 (1.03%) |
70.05 |
68.68 - 76.29 |
1.0717 times |
Fri 28 February 2025 |
70.17 (-1.94%) |
70.50 |
67.53 - 71.97 |
0.9137 times |
Fri 31 January 2025 |
71.56 (-0.18%) |
72.47 |
65.89 - 74.05 |
1.1788 times |
Tue 31 December 2024 |
71.69 (-7.48%) |
75.50 |
69.32 - 75.63 |
0.6464 times |
DMA SMA EMA moving averages of Nextera Energy NEE
DMA (daily moving average) of Nextera Energy NEE
| DMA period | DMA value | | 5 day DMA | 84.96 | | 12 day DMA | 82.31 | | 20 day DMA | 78.74 | | 35 day DMA | 75.5 | | 50 day DMA | 75.13 | | 100 day DMA | 73.59 | | 150 day DMA | 72.01 | | 200 day DMA | 71.64 | EMA (exponential moving average) of Nextera Energy NEE
| EMA period | EMA current | EMA prev | EMA prev2 | | 5 day EMA | 84.48 | 84.34 | 84.24 | | 12 day EMA | 82.28 | 81.83 | 81.34 | | 20 day EMA | 80.07 | 79.57 | 79.05 | | 35 day EMA | 77.84 | 77.43 | 77.01 | | 50 day EMA | 75.76 | 75.39 | 75.02 |
SMA (simple moving average) of Nextera Energy NEE
| SMA period | SMA current | SMA prev | SMA prev2 | | 5 day SMA | 84.96 | 84.86 | 84.6 | | 12 day SMA | 82.31 | 81.6 | 80.88 | | 20 day SMA | 78.74 | 78.02 | 77.28 | | 35 day SMA | 75.5 | 75.19 | 74.91 | | 50 day SMA | 75.13 | 74.85 | 74.58 | | 100 day SMA | 73.59 | 73.46 | 73.36 | | 150 day SMA | 72.01 | 71.93 | 71.86 | | 200 day SMA | 71.64 | 71.57 | 71.51 |
|
|
