NobleCorporation NE full analysis,charts,indicators,moving averages,SMA,DMA,EMA,ADX,MACD,RSINoble Corporation NE WideScreen charts, DMA,SMA,EMA technical analysis, forecast prediction, by indicators ADX,MACD,RSI,CCI USA stock exchange
operates under Energy sector & deals in Oil Gas Production
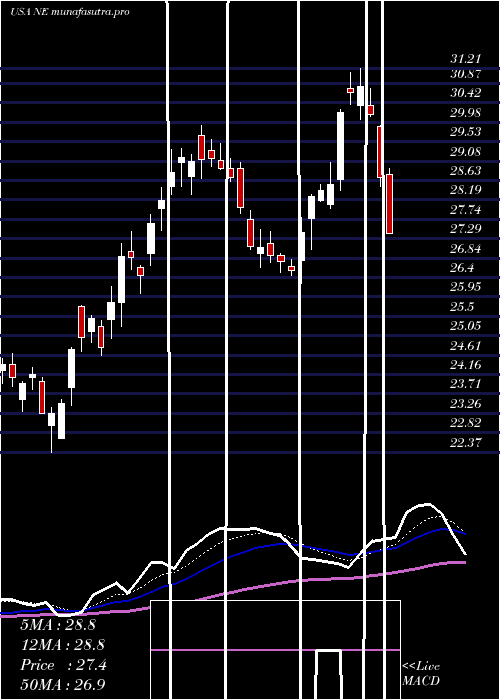
Daily price and charts and targets NobleCorporation Strong Daily Stock price targets for NobleCorporation NE are 31.79 and 32.85 | Daily Target 1 | 31.54 | | Daily Target 2 | 32.04 | | Daily Target 3 | 32.603333333333 | | Daily Target 4 | 33.1 | | Daily Target 5 | 33.66 |
Daily price and volume Noble Corporation
| Date |
Closing |
Open |
Range |
Volume |
Thu 04 December 2025 |
32.53 (-3.24%) |
33.17 |
32.11 - 33.17 |
1.2033 times |
Wed 03 December 2025 |
33.62 (8.1%) |
31.38 |
31.34 - 33.66 |
1.6215 times |
Tue 02 December 2025 |
31.10 (-0.8%) |
31.34 |
30.50 - 31.46 |
0.6078 times |
Mon 01 December 2025 |
31.35 (2.38%) |
30.42 |
30.35 - 31.78 |
1.2748 times |
Fri 28 November 2025 |
30.62 (0.62%) |
30.52 |
30.26 - 30.93 |
0.4284 times |
Wed 26 November 2025 |
30.43 (-0.23%) |
30.43 |
30.37 - 30.86 |
1.0111 times |
Tue 25 November 2025 |
30.50 (1.09%) |
30.16 |
29.20 - 30.74 |
1.075 times |
Mon 24 November 2025 |
30.17 (0.33%) |
29.73 |
29.30 - 30.48 |
0.7302 times |
Fri 21 November 2025 |
30.07 (2.24%) |
29.17 |
28.76 - 30.23 |
0.861 times |
Thu 20 November 2025 |
29.41 (-1.84%) |
30.33 |
29.19 - 31.13 |
1.1868 times |
Wed 19 November 2025 |
29.96 (-2.16%) |
29.81 |
29.66 - 30.61 |
0.8957 times |
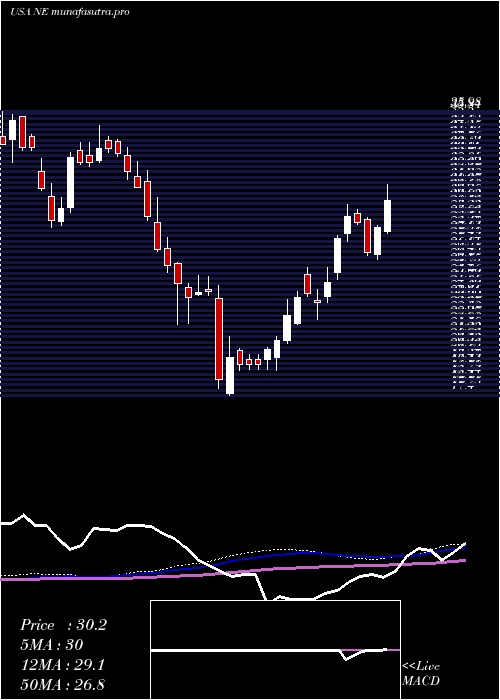
Weekly price and charts NobleCorporation Strong weekly Stock price targets for NobleCorporation NE are 31.44 and 34.75 | Weekly Target 1 | 28.87 | | Weekly Target 2 | 30.7 | | Weekly Target 3 | 32.18 | | Weekly Target 4 | 34.01 | | Weekly Target 5 | 35.49 |
Weekly price and volumes for Noble Corporation
| Date |
Closing |
Open |
Range |
Volume |
Thu 04 December 2025 |
32.53 (6.24%) |
30.42 |
30.35 - 33.66 |
1.1897 times |
Fri 28 November 2025 |
30.62 (1.83%) |
29.73 |
29.20 - 30.93 |
0.82 times |
Fri 21 November 2025 |
30.07 (-0.82%) |
30.35 |
28.76 - 31.13 |
1.2428 times |
Fri 14 November 2025 |
30.32 (3.73%) |
29.49 |
28.75 - 30.95 |
1.0483 times |
Fri 07 November 2025 |
29.23 (-0.41%) |
29.10 |
28.15 - 29.62 |
0.6525 times |
Fri 31 October 2025 |
29.35 (0%) |
29.59 |
29.20 - 30.00 |
0.2081 times |
Fri 31 October 2025 |
29.35 (-3.96%) |
30.95 |
28.71 - 31.14 |
1.7038 times |
Fri 24 October 2025 |
30.56 (11.21%) |
27.63 |
27.46 - 31.32 |
1.374 times |
Fri 17 October 2025 |
27.48 (-9.1%) |
27.37 |
26.73 - 28.62 |
1.2578 times |
Tue 07 October 2025 |
30.23 (1.1%) |
30.29 |
29.79 - 30.75 |
0.503 times |
Fri 03 October 2025 |
29.90 (2.29%) |
29.10 |
27.79 - 30.10 |
1.5217 times |
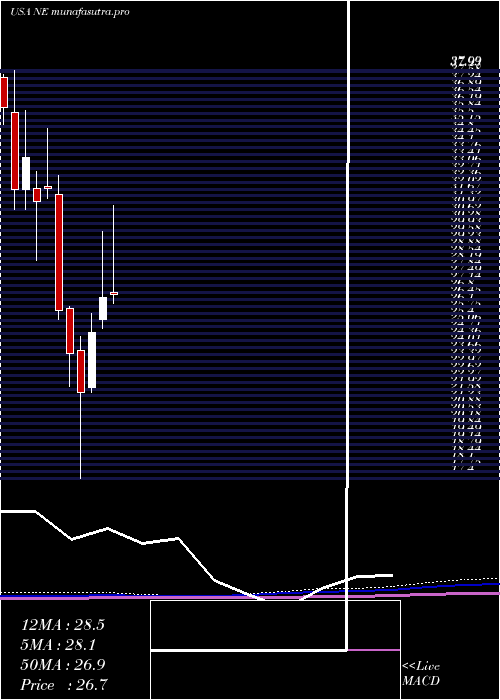
Monthly price and charts NobleCorporation Strong monthly Stock price targets for NobleCorporation NE are 31.44 and 34.75 | Monthly Target 1 | 28.87 | | Monthly Target 2 | 30.7 | | Monthly Target 3 | 32.18 | | Monthly Target 4 | 34.01 | | Monthly Target 5 | 35.49 |
Monthly price and volumes Noble Corporation
| Date |
Closing |
Open |
Range |
Volume |
Thu 04 December 2025 |
32.53 (6.24%) |
30.42 |
30.35 - 33.66 |
0.1725 times |
Fri 28 November 2025 |
30.62 (4.33%) |
29.10 |
28.15 - 31.13 |
0.5457 times |
Fri 31 October 2025 |
29.35 (3.78%) |
28.10 |
26.73 - 31.32 |
0.8479 times |
Tue 30 September 2025 |
28.28 (-1.87%) |
28.31 |
27.53 - 31.99 |
1.9271 times |
Fri 29 August 2025 |
28.82 (7.5%) |
26.09 |
25.24 - 29.01 |
0.809 times |
Thu 31 July 2025 |
26.81 (0.98%) |
26.79 |
26.26 - 31.21 |
0.9174 times |
Mon 30 June 2025 |
26.55 (7.19%) |
25.43 |
25.00 - 29.89 |
1.0522 times |
Fri 30 May 2025 |
24.77 (13.94%) |
22.00 |
21.75 - 25.74 |
0.9809 times |
Wed 30 April 2025 |
21.74 (-8.27%) |
23.89 |
17.40 - 24.58 |
1.5327 times |
Mon 31 March 2025 |
23.70 (-8.49%) |
26.00 |
22.05 - 26.10 |
1.2147 times |
Fri 28 February 2025 |
25.90 (-19.19%) |
31.73 |
25.44 - 32.70 |
0.9178 times |
DMA SMA EMA moving averages of Noble Corporation NE
DMA (daily moving average) of Noble Corporation NE
| DMA period | DMA value | | 5 day DMA | 31.84 | | 12 day DMA | 30.87 | | 20 day DMA | 30.38 | | 35 day DMA | 29.83 | | 50 day DMA | 29.53 | | 100 day DMA | 28.86 | | 150 day DMA | 27.89 | | 200 day DMA | 26.71 | EMA (exponential moving average) of Noble Corporation NE
| EMA period | EMA current | EMA prev | EMA prev2 | | 5 day EMA | 32.02 | 31.76 | 30.83 | | 12 day EMA | 31.17 | 30.92 | 30.43 | | 20 day EMA | 30.68 | 30.49 | 30.16 | | 35 day EMA | 30.19 | 30.05 | 29.84 | | 50 day EMA | 29.82 | 29.71 | 29.55 |
SMA (simple moving average) of Noble Corporation NE
| SMA period | SMA current | SMA prev | SMA prev2 | | 5 day SMA | 31.84 | 31.42 | 30.8 | | 12 day SMA | 30.87 | 30.65 | 30.37 | | 20 day SMA | 30.38 | 30.18 | 29.95 | | 35 day SMA | 29.83 | 29.71 | 29.53 | | 50 day SMA | 29.53 | 29.44 | 29.37 | | 100 day SMA | 28.86 | 28.85 | 28.82 | | 150 day SMA | 27.89 | 27.81 | 27.73 | | 200 day SMA | 26.71 | 26.7 | 26.69 |
|
|
