NordsonCorporation NDSN full analysis,charts,indicators,moving averages,SMA,DMA,EMA,ADX,MACD,RSINordson Corporation NDSN WideScreen charts, DMA,SMA,EMA technical analysis, forecast prediction, by indicators ADX,MACD,RSI,CCI USA stock exchange
operates under Capital Goods sector & deals in Industrial Machinery Components
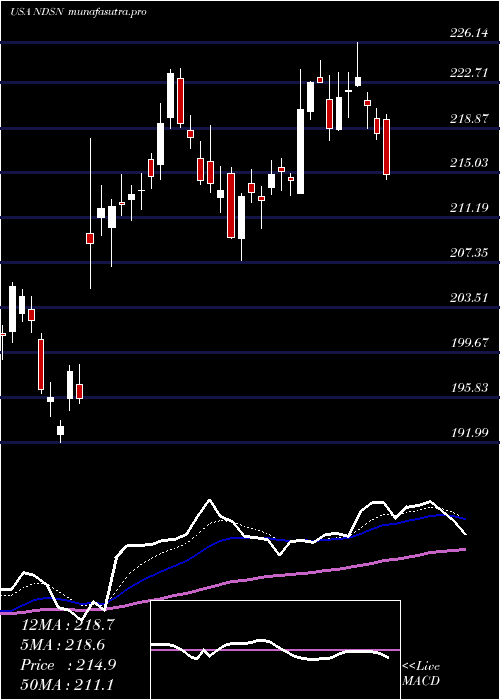
Daily price and charts and targets NordsonCorporation Strong Daily Stock price targets for NordsonCorporation NDSN are 235.56 and 242.63 | Daily Target 1 | 230.12 | | Daily Target 2 | 233.93 | | Daily Target 3 | 237.19333333333 | | Daily Target 4 | 241 | | Daily Target 5 | 244.26 |
Daily price and volume Nordson Corporation
| Date |
Closing |
Open |
Range |
Volume |
Tue 21 October 2025 |
237.73 (0.88%) |
235.03 |
233.39 - 240.46 |
0.7391 times |
Mon 20 October 2025 |
235.66 (0.99%) |
234.41 |
234.00 - 236.95 |
0.6875 times |
Fri 17 October 2025 |
233.34 (0.58%) |
231.53 |
230.60 - 233.53 |
1.1713 times |
Thu 16 October 2025 |
232.00 (0.06%) |
232.39 |
231.13 - 234.37 |
1.0206 times |
Wed 15 October 2025 |
231.85 (-0.65%) |
234.06 |
229.00 - 235.77 |
0.7822 times |
Tue 14 October 2025 |
233.37 (1.24%) |
227.71 |
225.32 - 234.93 |
0.8416 times |
Mon 13 October 2025 |
230.52 (1.03%) |
229.68 |
229.58 - 233.38 |
1.0663 times |
Fri 10 October 2025 |
228.16 (-2.4%) |
234.30 |
227.96 - 236.36 |
1.7878 times |
Thu 09 October 2025 |
233.76 (-0.24%) |
234.53 |
231.77 - 235.38 |
0.9359 times |
Wed 08 October 2025 |
234.32 (1.5%) |
230.58 |
229.13 - 234.92 |
0.9676 times |
Tue 07 October 2025 |
230.85 (-1.4%) |
234.97 |
230.41 - 235.52 |
0.5962 times |
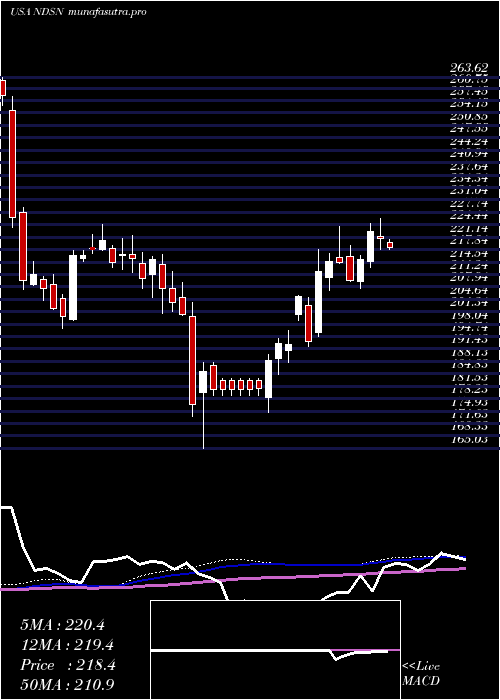
Weekly price and charts NordsonCorporation Strong weekly Stock price targets for NordsonCorporation NDSN are 235.56 and 242.63 | Weekly Target 1 | 230.12 | | Weekly Target 2 | 233.93 | | Weekly Target 3 | 237.19333333333 | | Weekly Target 4 | 241 | | Weekly Target 5 | 244.26 |
Weekly price and volumes for Nordson Corporation
| Date |
Closing |
Open |
Range |
Volume |
Tue 21 October 2025 |
237.73 (1.88%) |
234.41 |
233.39 - 240.46 |
0.3288 times |
Fri 17 October 2025 |
233.34 (2.27%) |
229.68 |
225.32 - 235.77 |
1.1251 times |
Fri 10 October 2025 |
228.16 (-2.27%) |
233.97 |
227.96 - 236.36 |
1.1702 times |
Fri 03 October 2025 |
233.45 (2.84%) |
227.99 |
224.27 - 235.02 |
0.9205 times |
Fri 26 September 2025 |
227.00 (0.85%) |
225.07 |
220.47 - 228.12 |
1.0145 times |
Fri 19 September 2025 |
225.08 (0.86%) |
223.18 |
223.00 - 230.99 |
1.6459 times |
Fri 12 September 2025 |
223.17 (-0.83%) |
225.70 |
221.09 - 228.23 |
1.2288 times |
Fri 05 September 2025 |
225.03 (-0.03%) |
223.43 |
220.06 - 229.02 |
0.8337 times |
Fri 29 August 2025 |
225.09 (0%) |
224.96 |
224.12 - 226.58 |
0.2396 times |
Fri 29 August 2025 |
225.09 (-0.92%) |
226.64 |
223.24 - 228.79 |
1.493 times |
Fri 22 August 2025 |
227.17 (6.43%) |
213.16 |
211.50 - 235.71 |
2.7786 times |
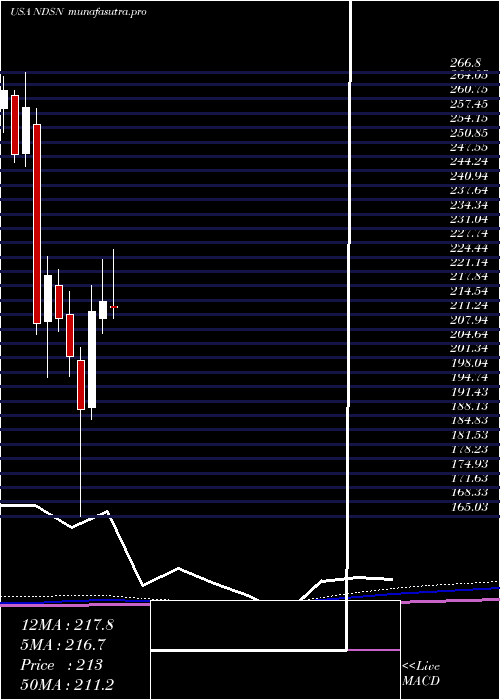
Monthly price and charts NordsonCorporation Strong monthly Stock price targets for NordsonCorporation NDSN are 231.37 and 246.83 | Monthly Target 1 | 218.94 | | Monthly Target 2 | 228.33 | | Monthly Target 3 | 234.39666666667 | | Monthly Target 4 | 243.79 | | Monthly Target 5 | 249.86 |
Monthly price and volumes Nordson Corporation
| Date |
Closing |
Open |
Range |
Volume |
Tue 21 October 2025 |
237.73 (4.75%) |
225.58 |
225.00 - 240.46 |
0.5162 times |
Tue 30 September 2025 |
226.95 (0.83%) |
223.43 |
220.06 - 230.99 |
0.8381 times |
Fri 29 August 2025 |
225.09 (5.08%) |
210.37 |
207.08 - 235.71 |
1.1339 times |
Thu 31 July 2025 |
214.21 (-0.07%) |
213.24 |
210.43 - 226.14 |
0.9299 times |
Mon 30 June 2025 |
214.37 (1.12%) |
210.36 |
207.00 - 223.95 |
1.3377 times |
Fri 30 May 2025 |
211.99 (11.83%) |
189.90 |
187.24 - 218.00 |
1.0716 times |
Wed 30 April 2025 |
189.57 (-6.02%) |
200.85 |
165.03 - 203.71 |
1.2787 times |
Mon 31 March 2025 |
201.72 (-4.08%) |
211.30 |
197.00 - 216.48 |
0.8576 times |
Fri 28 February 2025 |
210.29 (-4.51%) |
218.08 |
207.39 - 221.59 |
0.8808 times |
Fri 31 January 2025 |
220.22 (5.25%) |
209.64 |
196.83 - 224.52 |
1.1555 times |
Tue 31 December 2024 |
209.24 (-19.13%) |
254.80 |
206.80 - 258.63 |
1.1229 times |
DMA SMA EMA moving averages of Nordson Corporation NDSN
DMA (daily moving average) of Nordson Corporation NDSN
| DMA period | DMA value | | 5 day DMA | 234.12 | | 12 day DMA | 232.97 | | 20 day DMA | 230.79 | | 35 day DMA | 228.3 | | 50 day DMA | 226.21 | | 100 day DMA | 221.11 | | 150 day DMA | 211.16 | | 200 day DMA | 211.63 | EMA (exponential moving average) of Nordson Corporation NDSN
| EMA period | EMA current | EMA prev | EMA prev2 | | 5 day EMA | 234.89 | 233.47 | 232.37 | | 12 day EMA | 232.93 | 232.06 | 231.4 | | 20 day EMA | 231.24 | 230.56 | 230.02 | | 35 day EMA | 228.54 | 228 | 227.55 | | 50 day EMA | 225.86 | 225.38 | 224.96 |
SMA (simple moving average) of Nordson Corporation NDSN
| SMA period | SMA current | SMA prev | SMA prev2 | | 5 day SMA | 234.12 | 233.24 | 232.22 | | 12 day SMA | 232.97 | 232.62 | 232.33 | | 20 day SMA | 230.79 | 230.15 | 229.63 | | 35 day SMA | 228.3 | 227.87 | 227.57 | | 50 day SMA | 226.21 | 225.77 | 225.27 | | 100 day SMA | 221.11 | 220.69 | 220.32 | | 150 day SMA | 211.16 | 210.97 | 210.8 | | 200 day SMA | 211.63 | 211.48 | 211.34 |
|
|
