NcsMultistage NCSM full analysis,charts,indicators,moving averages,SMA,DMA,EMA,ADX,MACD,RSINcs Multistage NCSM WideScreen charts, DMA,SMA,EMA technical analysis, forecast prediction, by indicators ADX,MACD,RSI,CCI USA stock exchange
operates under Energy sector & deals in Oilfield Services Equipment
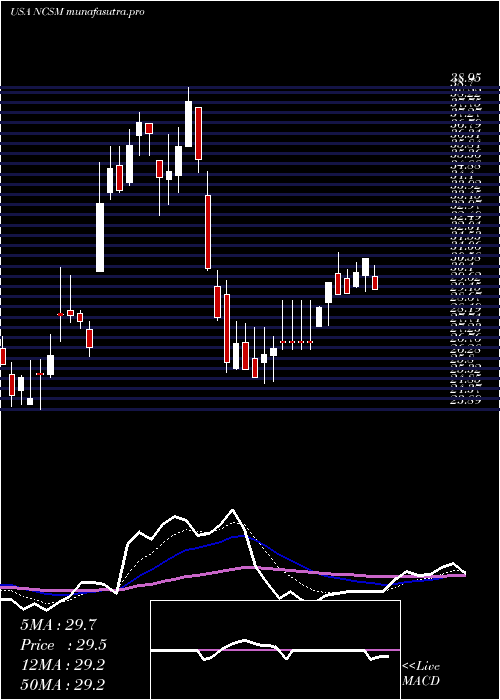
Daily price and charts and targets NcsMultistage Strong Daily Stock price targets for NcsMultistage NCSM are 38.51 and 40.49 | Daily Target 1 | 36.86 | | Daily Target 2 | 38.18 | | Daily Target 3 | 38.84 | | Daily Target 4 | 40.16 | | Daily Target 5 | 40.82 |
Daily price and volume Ncs Multistage
| Date |
Closing |
Open |
Range |
Volume |
Thu 04 December 2025 |
39.50 (5.56%) |
37.52 |
37.52 - 39.50 |
0.3792 times |
Wed 03 December 2025 |
37.42 (0.46%) |
38.01 |
35.17 - 38.01 |
1.2696 times |
Tue 02 December 2025 |
37.25 (-0.67%) |
38.18 |
36.65 - 38.18 |
0.5771 times |
Mon 01 December 2025 |
37.50 (3.99%) |
36.16 |
36.16 - 38.70 |
1.4097 times |
Fri 28 November 2025 |
36.06 (-3.69%) |
36.92 |
35.55 - 37.40 |
0.6678 times |
Wed 26 November 2025 |
37.44 (1.74%) |
36.27 |
36.27 - 37.79 |
1.4345 times |
Tue 25 November 2025 |
36.80 (4.72%) |
35.78 |
35.01 - 36.89 |
0.6925 times |
Mon 24 November 2025 |
35.14 (-5.41%) |
36.11 |
35.14 - 36.51 |
1.4097 times |
Fri 21 November 2025 |
37.15 (3.63%) |
35.85 |
35.20 - 37.15 |
0.8079 times |
Thu 20 November 2025 |
35.85 (-1.43%) |
37.40 |
34.06 - 37.40 |
1.352 times |
Wed 19 November 2025 |
36.37 (-0.36%) |
36.89 |
35.69 - 37.00 |
0.5771 times |
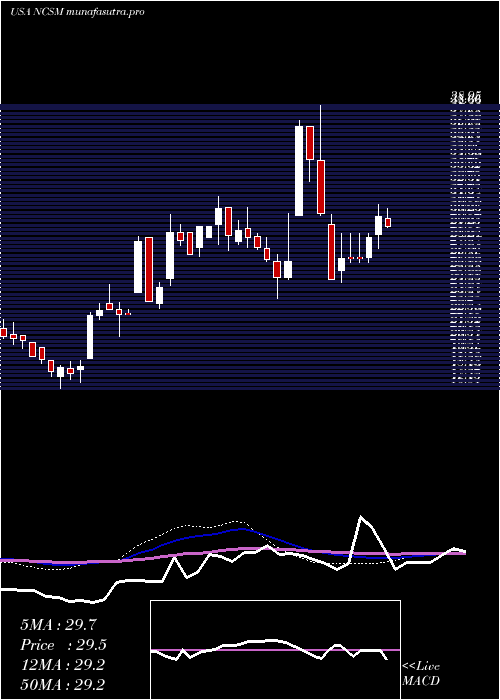
Weekly price and charts NcsMultistage Strong weekly Stock price targets for NcsMultistage NCSM are 37.34 and 41.67 | Weekly Target 1 | 33.73 | | Weekly Target 2 | 36.61 | | Weekly Target 3 | 38.056666666667 | | Weekly Target 4 | 40.94 | | Weekly Target 5 | 42.39 |
Weekly price and volumes for Ncs Multistage
| Date |
Closing |
Open |
Range |
Volume |
Thu 04 December 2025 |
39.50 (9.54%) |
36.16 |
35.17 - 39.50 |
0.7772 times |
Fri 28 November 2025 |
36.06 (-2.93%) |
36.11 |
35.01 - 37.79 |
0.8988 times |
Fri 21 November 2025 |
37.15 (0.27%) |
37.27 |
34.06 - 37.67 |
1.0398 times |
Fri 14 November 2025 |
37.05 (0.14%) |
36.85 |
36.52 - 38.97 |
1.1421 times |
Fri 07 November 2025 |
37.00 (0.82%) |
41.32 |
36.61 - 41.75 |
0.9217 times |
Fri 31 October 2025 |
36.70 (0%) |
38.95 |
35.06 - 38.99 |
0.4935 times |
Fri 31 October 2025 |
36.70 (-11.74%) |
41.90 |
35.06 - 42.88 |
1.2196 times |
Fri 24 October 2025 |
41.58 (14.14%) |
36.30 |
36.30 - 43.43 |
0.8706 times |
Fri 17 October 2025 |
36.43 (-12.83%) |
41.86 |
35.98 - 43.27 |
0.9905 times |
Fri 10 October 2025 |
41.79 (-1.88%) |
42.88 |
40.53 - 45.00 |
1.6461 times |
Fri 03 October 2025 |
42.59 (-19.76%) |
52.38 |
42.05 - 52.38 |
1.5516 times |
Monthly price and charts NcsMultistage Strong monthly Stock price targets for NcsMultistage NCSM are 37.34 and 41.67 | Monthly Target 1 | 33.73 | | Monthly Target 2 | 36.61 | | Monthly Target 3 | 38.056666666667 | | Monthly Target 4 | 40.94 | | Monthly Target 5 | 42.39 |
Monthly price and volumes Ncs Multistage
| Date |
Closing |
Open |
Range |
Volume |
Thu 04 December 2025 |
39.50 (9.54%) |
36.16 |
35.17 - 39.50 |
0.1919 times |
Fri 28 November 2025 |
36.06 (-1.74%) |
41.32 |
34.06 - 41.75 |
0.9881 times |
Fri 31 October 2025 |
36.70 (-28.12%) |
49.78 |
35.06 - 52.06 |
1.5704 times |
Tue 30 September 2025 |
51.06 (33.98%) |
38.15 |
38.15 - 53.69 |
1.7543 times |
Fri 29 August 2025 |
38.11 (24.26%) |
31.43 |
29.75 - 41.75 |
1.0973 times |
Thu 31 July 2025 |
30.67 (3.86%) |
29.00 |
28.73 - 31.98 |
0.5147 times |
Mon 30 June 2025 |
29.53 (0.92%) |
29.26 |
28.64 - 33.88 |
0.6048 times |
Fri 30 May 2025 |
29.26 (-0.85%) |
31.50 |
29.15 - 35.65 |
0.7736 times |
Wed 30 April 2025 |
29.51 (-15.66%) |
34.80 |
25.09 - 38.95 |
0.8698 times |
Mon 31 March 2025 |
34.99 (29.93%) |
26.72 |
23.89 - 37.74 |
1.635 times |
Fri 28 February 2025 |
26.93 (-6.49%) |
28.28 |
26.77 - 30.99 |
0.3067 times |

DMA SMA EMA moving averages of Ncs Multistage NCSM
DMA (daily moving average) of Ncs Multistage NCSM
| DMA period | DMA value | | 5 day DMA | 37.55 | | 12 day DMA | 36.92 | | 20 day DMA | 37.07 | | 35 day DMA | 38.15 | | 50 day DMA | 40.43 | | 100 day DMA | 39.23 | | 150 day DMA | 36.46 | | 200 day DMA | 34.69 | EMA (exponential moving average) of Ncs Multistage NCSM
| EMA period | EMA current | EMA prev | EMA prev2 | | 5 day EMA | 37.92 | 37.13 | 36.98 | | 12 day EMA | 37.43 | 37.05 | 36.98 | | 20 day EMA | 37.7 | 37.51 | 37.52 | | 35 day EMA | 39.18 | 39.16 | 39.26 | | 50 day EMA | 40.85 | 40.91 | 41.05 |
SMA (simple moving average) of Ncs Multistage NCSM
| SMA period | SMA current | SMA prev | SMA prev2 | | 5 day SMA | 37.55 | 37.13 | 37.01 | | 12 day SMA | 36.92 | 36.72 | 36.68 | | 20 day SMA | 37.07 | 37.04 | 37.21 | | 35 day SMA | 38.15 | 38.17 | 38.25 | | 50 day SMA | 40.43 | 40.66 | 40.88 | | 100 day SMA | 39.23 | 39.14 | 39.07 | | 150 day SMA | 36.46 | 36.39 | 36.35 | | 200 day SMA | 34.69 | 34.63 | 34.59 |
|
|
