NucanaPlc NCNA full analysis,charts,indicators,moving averages,SMA,DMA,EMA,ADX,MACD,RSINucana Plc NCNA WideScreen charts, DMA,SMA,EMA technical analysis, forecast prediction, by indicators ADX,MACD,RSI,CCI USA stock exchange
operates under Health Care sector & deals in Major Pharmaceuticals
Daily price and charts and targets NucanaPlc Strong Daily Stock price targets for NucanaPlc NCNA are 4.29 and 4.63 | Daily Target 1 | 4.01 | | Daily Target 2 | 4.22 | | Daily Target 3 | 4.35 | | Daily Target 4 | 4.56 | | Daily Target 5 | 4.69 |
Daily price and volume Nucana Plc
| Date |
Closing |
Open |
Range |
Volume |
Thu 04 December 2025 |
4.43 (4.48%) |
4.19 |
4.14 - 4.48 |
0.6982 times |
Wed 03 December 2025 |
4.24 (6.53%) |
4.00 |
4.00 - 4.34 |
1.0134 times |
Tue 02 December 2025 |
3.98 (-0.5%) |
4.01 |
3.82 - 4.01 |
0.3352 times |
Mon 01 December 2025 |
4.00 (-6.54%) |
4.16 |
3.97 - 4.16 |
0.6117 times |
Fri 28 November 2025 |
4.28 (7.81%) |
3.99 |
3.99 - 4.35 |
1.2126 times |
Wed 26 November 2025 |
3.97 (3.12%) |
3.88 |
3.82 - 4.06 |
0.689 times |
Tue 25 November 2025 |
3.85 (1.32%) |
3.76 |
3.70 - 3.94 |
1.1261 times |
Mon 24 November 2025 |
3.80 (8.57%) |
3.40 |
3.40 - 3.84 |
0.919 times |
Fri 21 November 2025 |
3.50 (-1.69%) |
3.48 |
3.38 - 3.60 |
1.0559 times |
Thu 20 November 2025 |
3.56 (6.27%) |
3.33 |
3.33 - 3.88 |
2.3388 times |
Wed 19 November 2025 |
3.35 (1.21%) |
3.30 |
3.22 - 3.37 |
0.519 times |
Weekly price and charts NucanaPlc Strong weekly Stock price targets for NucanaPlc NCNA are 4.13 and 4.79 | Weekly Target 1 | 3.58 | | Weekly Target 2 | 4.01 | | Weekly Target 3 | 4.2433333333333 | | Weekly Target 4 | 4.67 | | Weekly Target 5 | 4.9 |
Weekly price and volumes for Nucana Plc
| Date |
Closing |
Open |
Range |
Volume |
Thu 04 December 2025 |
4.43 (3.5%) |
4.16 |
3.82 - 4.48 |
0.1671 times |
Fri 28 November 2025 |
4.28 (22.29%) |
3.40 |
3.40 - 4.35 |
0.2481 times |
Fri 21 November 2025 |
3.50 (2.64%) |
3.30 |
3.10 - 3.88 |
0.4292 times |
Fri 14 November 2025 |
3.41 (-7.34%) |
3.80 |
3.24 - 3.86 |
0.3146 times |
Fri 07 November 2025 |
3.68 (-8.23%) |
3.75 |
3.52 - 3.98 |
0.25 times |
Fri 31 October 2025 |
4.01 (0%) |
3.80 |
3.80 - 4.07 |
0.0732 times |
Fri 31 October 2025 |
4.01 (-7.6%) |
4.20 |
3.71 - 4.38 |
0.4506 times |
Fri 24 October 2025 |
4.34 (-15.23%) |
5.91 |
3.81 - 7.80 |
2.1294 times |
Fri 17 October 2025 |
5.12 (-3.94%) |
5.83 |
5.00 - 6.16 |
1.3095 times |
Fri 10 October 2025 |
5.33 (10.58%) |
4.86 |
4.53 - 7.22 |
4.6284 times |
Fri 03 October 2025 |
4.82 (20.2%) |
3.97 |
3.79 - 5.18 |
5.3417 times |

Monthly price and charts NucanaPlc Strong monthly Stock price targets for NucanaPlc NCNA are 4.13 and 4.79 | Monthly Target 1 | 3.58 | | Monthly Target 2 | 4.01 | | Monthly Target 3 | 4.2433333333333 | | Monthly Target 4 | 4.67 | | Monthly Target 5 | 4.9 |
Monthly price and volumes Nucana Plc
| Date |
Closing |
Open |
Range |
Volume |
Thu 04 December 2025 |
4.43 (3.5%) |
4.16 |
3.82 - 4.48 |
0.0001 times |
Fri 28 November 2025 |
4.28 (6.73%) |
3.75 |
3.10 - 4.35 |
0.0008 times |
Fri 31 October 2025 |
4.01 (-13.58%) |
4.42 |
3.71 - 7.80 |
0.0066 times |
Tue 30 September 2025 |
4.64 (45.45%) |
3.19 |
2.78 - 5.18 |
0.0081 times |
Fri 29 August 2025 |
3.19 (7875%) |
0.04 |
0.03 - 5.70 |
0.4398 times |
Thu 31 July 2025 |
0.04 (-33.33%) |
0.06 |
0.04 - 0.13 |
3.8936 times |
Mon 30 June 2025 |
0.06 (50%) |
0.04 |
0.03 - 0.20 |
3.9785 times |
Fri 30 May 2025 |
0.04 (-93.22%) |
0.58 |
0.03 - 1.25 |
1.6696 times |
Wed 30 April 2025 |
0.59 (-32.18%) |
0.97 |
0.52 - 0.98 |
0.0019 times |
Mon 31 March 2025 |
0.87 (-10.31%) |
0.93 |
0.69 - 1.34 |
0.001 times |
Fri 28 February 2025 |
0.97 (-4.9%) |
1.01 |
0.86 - 1.10 |
0.0006 times |

DMA SMA EMA moving averages of Nucana Plc NCNA
DMA (daily moving average) of Nucana Plc NCNA
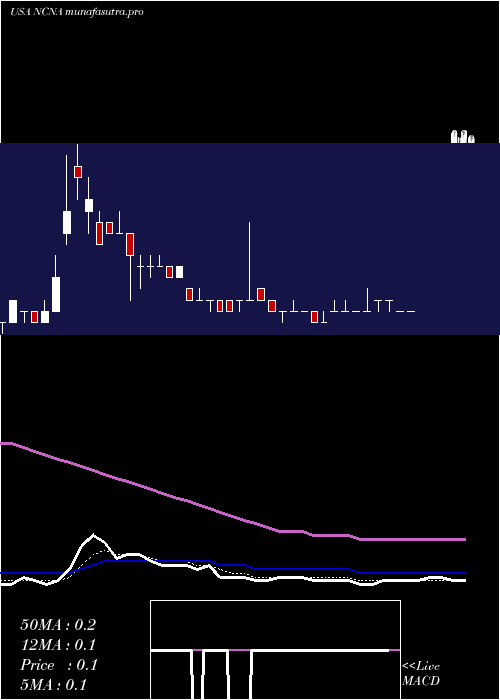
| DMA period | DMA value | | 5 day DMA | 4.19 | | 12 day DMA | 3.86 | | 20 day DMA | 3.75 | | 35 day DMA | 3.96 | | 50 day DMA | 4.31 | | 100 day DMA | 3.36 | | 150 day DMA | 2.28 | | 200 day DMA | 1.92 | EMA (exponential moving average) of Nucana Plc NCNA
| EMA period | EMA current | EMA prev | EMA prev2 | | 5 day EMA | 4.18 | 4.05 | 3.96 | | 12 day EMA | 3.98 | 3.9 | 3.84 | | 20 day EMA | 3.94 | 3.89 | 3.85 | | 35 day EMA | 4.07 | 4.05 | 4.04 | | 50 day EMA | 4.28 | 4.27 | 4.27 |
SMA (simple moving average) of Nucana Plc NCNA
| SMA period | SMA current | SMA prev | SMA prev2 | | 5 day SMA | 4.19 | 4.09 | 4.02 | | 12 day SMA | 3.86 | 3.75 | 3.68 | | 20 day SMA | 3.75 | 3.71 | 3.68 | | 35 day SMA | 3.96 | 3.98 | 4.03 | | 50 day SMA | 4.31 | 4.3 | 4.3 | | 100 day SMA | 3.36 | 3.31 | 3.27 | | 150 day SMA | 2.28 | 2.25 | 2.23 | | 200 day SMA | 1.92 | 1.9 | 1.88 |
|
|
