NorwegianCruise NCLH full analysis,charts,indicators,moving averages,SMA,DMA,EMA,ADX,MACD,RSINorwegian Cruise NCLH WideScreen charts, DMA,SMA,EMA technical analysis, forecast prediction, by indicators ADX,MACD,RSI,CCI USA stock exchange
operates under Consumer Services sector & deals in Marine Transportation
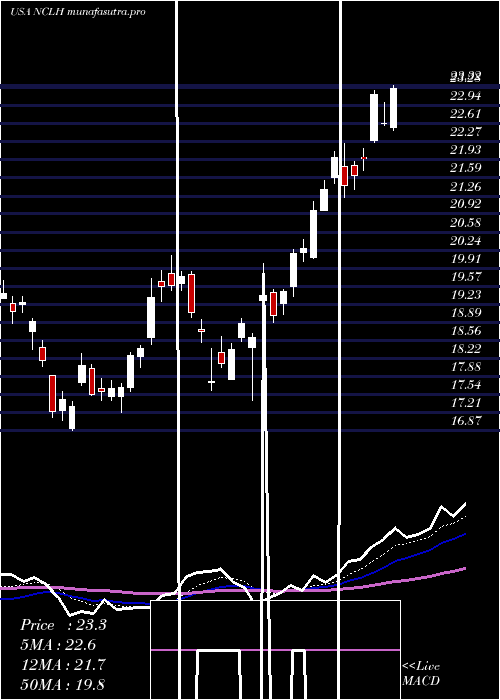
Daily price and charts and targets NorwegianCruise Strong Daily Stock price targets for NorwegianCruise NCLH are 23.13 and 23.47 | Daily Target 1 | 22.85 | | Daily Target 2 | 23.06 | | Daily Target 3 | 23.193333333333 | | Daily Target 4 | 23.4 | | Daily Target 5 | 23.53 |
Daily price and volume Norwegian Cruise
| Date |
Closing |
Open |
Range |
Volume |
Mon 20 October 2025 |
23.26 (1.31%) |
23.03 |
22.99 - 23.33 |
0.7165 times |
Fri 17 October 2025 |
22.96 (0.57%) |
22.34 |
22.04 - 23.12 |
0.9458 times |
Thu 16 October 2025 |
22.83 (-3.18%) |
23.62 |
22.72 - 23.77 |
0.8918 times |
Wed 15 October 2025 |
23.58 (-0.72%) |
23.91 |
23.48 - 23.99 |
0.9675 times |
Tue 14 October 2025 |
23.75 (3.08%) |
22.55 |
22.46 - 23.99 |
1.0361 times |
Mon 13 October 2025 |
23.04 (2.63%) |
22.95 |
22.79 - 23.25 |
0.9571 times |
Fri 10 October 2025 |
22.45 (-3.61%) |
23.16 |
22.43 - 23.62 |
1.3573 times |
Thu 09 October 2025 |
23.29 (-1.65%) |
23.90 |
23.22 - 23.93 |
1.0795 times |
Wed 08 October 2025 |
23.68 (-0.92%) |
24.00 |
23.54 - 24.10 |
1.0162 times |
Tue 07 October 2025 |
23.90 (-0.95%) |
24.20 |
23.37 - 24.21 |
1.0322 times |
Mon 06 October 2025 |
24.13 (-1.03%) |
24.38 |
23.65 - 24.48 |
0.9409 times |
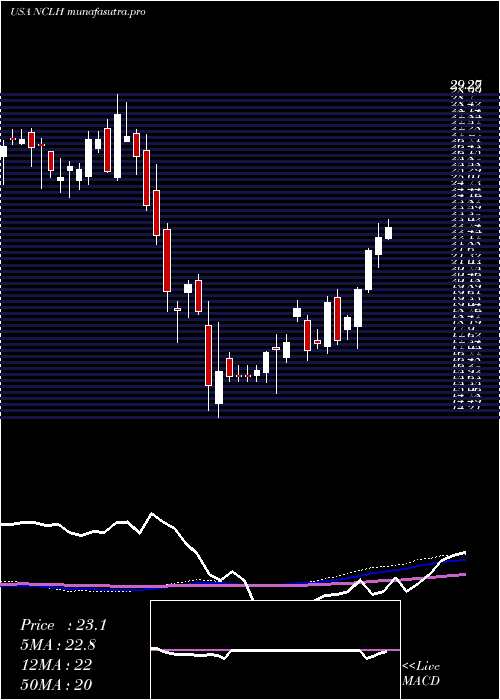
Weekly price and charts NorwegianCruise Strong weekly Stock price targets for NorwegianCruise NCLH are 23.13 and 23.47 | Weekly Target 1 | 22.85 | | Weekly Target 2 | 23.06 | | Weekly Target 3 | 23.193333333333 | | Weekly Target 4 | 23.4 | | Weekly Target 5 | 23.53 |
Weekly price and volumes for Norwegian Cruise
| Date |
Closing |
Open |
Range |
Volume |
Mon 20 October 2025 |
23.26 (1.31%) |
23.03 |
22.99 - 23.33 |
0.1308 times |
Fri 17 October 2025 |
22.96 (2.27%) |
22.95 |
22.04 - 23.99 |
0.8761 times |
Fri 10 October 2025 |
22.45 (-7.92%) |
24.38 |
22.43 - 24.48 |
0.9908 times |
Fri 03 October 2025 |
24.38 (-2.64%) |
25.81 |
24.11 - 26.09 |
1.1227 times |
Fri 26 September 2025 |
25.04 (-0.75%) |
25.13 |
24.72 - 26.09 |
0.8976 times |
Fri 19 September 2025 |
25.23 (-5.33%) |
26.73 |
24.87 - 26.73 |
1.3358 times |
Fri 12 September 2025 |
26.65 (3.86%) |
25.44 |
24.36 - 27.18 |
2.3066 times |
Fri 05 September 2025 |
25.66 (3.3%) |
24.10 |
23.95 - 26.28 |
1.0864 times |
Fri 29 August 2025 |
24.84 (0%) |
25.35 |
24.69 - 25.52 |
0.2133 times |
Fri 29 August 2025 |
24.84 (-0.84%) |
24.82 |
24.29 - 25.59 |
1.0399 times |
Fri 22 August 2025 |
25.05 (3.09%) |
24.22 |
23.13 - 25.18 |
1.3067 times |
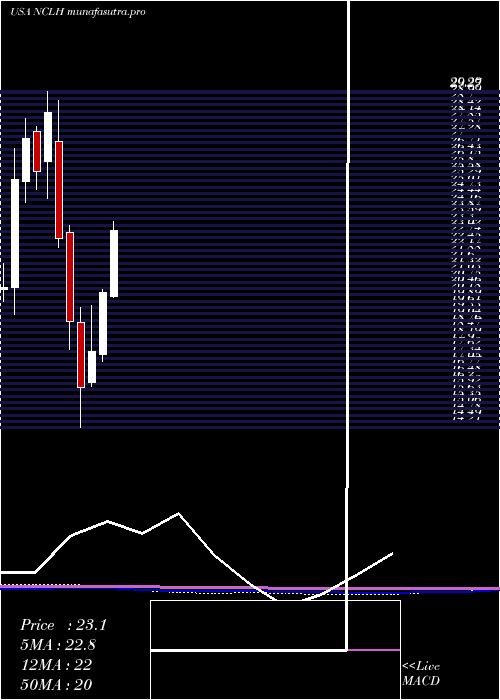
Monthly price and charts NorwegianCruise Strong monthly Stock price targets for NorwegianCruise NCLH are 21.2 and 24.1 | Monthly Target 1 | 20.51 | | Monthly Target 2 | 21.89 | | Monthly Target 3 | 23.413333333333 | | Monthly Target 4 | 24.79 | | Monthly Target 5 | 26.31 |
Monthly price and volumes Norwegian Cruise
| Date |
Closing |
Open |
Range |
Volume |
Mon 20 October 2025 |
23.26 (-5.56%) |
24.28 |
22.04 - 24.94 |
0.5106 times |
Tue 30 September 2025 |
24.63 (-0.85%) |
24.10 |
23.95 - 27.18 |
1.2527 times |
Fri 29 August 2025 |
24.84 (-2.82%) |
24.99 |
23.13 - 25.59 |
0.9833 times |
Thu 31 July 2025 |
25.56 (26.04%) |
20.10 |
20.08 - 27.10 |
1.2225 times |
Mon 30 June 2025 |
20.28 (14.9%) |
17.50 |
17.20 - 20.44 |
1.1293 times |
Fri 30 May 2025 |
17.65 (10.11%) |
16.23 |
16.05 - 19.68 |
1.0815 times |
Wed 30 April 2025 |
16.03 (-15.45%) |
18.95 |
14.21 - 19.59 |
1.225 times |
Mon 31 March 2025 |
18.96 (-16.55%) |
22.97 |
17.71 - 23.28 |
1.1396 times |
Fri 28 February 2025 |
22.72 (-19.86%) |
27.08 |
22.28 - 28.91 |
0.7766 times |
Fri 31 January 2025 |
28.35 (10.18%) |
26.18 |
24.48 - 29.29 |
0.6788 times |
Tue 31 December 2024 |
25.73 (-5.33%) |
27.50 |
24.89 - 27.72 |
0.5096 times |
DMA SMA EMA moving averages of Norwegian Cruise NCLH
DMA (daily moving average) of Norwegian Cruise NCLH
| DMA period | DMA value | | 5 day DMA | 23.28 | | 12 day DMA | 23.44 | | 20 day DMA | 24.01 | | 35 day DMA | 24.67 | | 50 day DMA | 24.64 | | 100 day DMA | 22.98 | | 150 day DMA | 21.23 | | 200 day DMA | 22.19 | EMA (exponential moving average) of Norwegian Cruise NCLH
| EMA period | EMA current | EMA prev | EMA prev2 | | 5 day EMA | 23.19 | 23.16 | 23.26 | | 12 day EMA | 23.5 | 23.54 | 23.65 | | 20 day EMA | 23.84 | 23.9 | 24 | | 35 day EMA | 24.15 | 24.2 | 24.27 | | 50 day EMA | 24.49 | 24.54 | 24.6 |
SMA (simple moving average) of Norwegian Cruise NCLH
| SMA period | SMA current | SMA prev | SMA prev2 | | 5 day SMA | 23.28 | 23.23 | 23.13 | | 12 day SMA | 23.44 | 23.55 | 23.65 | | 20 day SMA | 24.01 | 24.12 | 24.23 | | 35 day SMA | 24.67 | 24.72 | 24.77 | | 50 day SMA | 24.64 | 24.64 | 24.67 | | 100 day SMA | 22.98 | 22.92 | 22.87 | | 150 day SMA | 21.23 | 21.21 | 21.18 | | 200 day SMA | 22.19 | 22.2 | 22.22 |
|
|
