NaccoIndustries NC full analysis,charts,indicators,moving averages,SMA,DMA,EMA,ADX,MACD,RSINacco Industries NC WideScreen charts, DMA,SMA,EMA technical analysis, forecast prediction, by indicators ADX,MACD,RSI,CCI USA stock exchange
operates under Consumer Durables sector & deals in Consumer Electronics Appliances
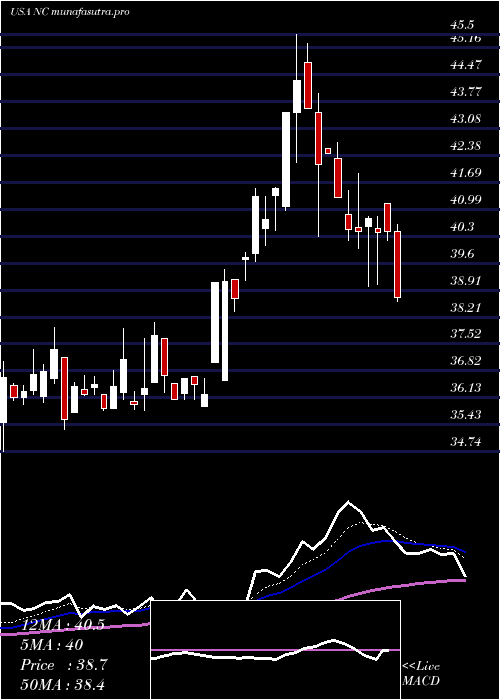
Daily price and charts and targets NaccoIndustries Strong Daily Stock price targets for NaccoIndustries NC are 44.24 and 45.66 | Daily Target 1 | 43.06 | | Daily Target 2 | 44 | | Daily Target 3 | 44.476666666667 | | Daily Target 4 | 45.42 | | Daily Target 5 | 45.9 |
Daily price and volume Nacco Industries
| Date |
Closing |
Open |
Range |
Volume |
Mon 20 October 2025 |
44.95 (0.45%) |
44.75 |
43.53 - 44.95 |
1.2104 times |
Fri 17 October 2025 |
44.75 (0.67%) |
44.44 |
43.50 - 44.95 |
0.8623 times |
Thu 16 October 2025 |
44.45 (0.91%) |
43.74 |
43.31 - 44.54 |
0.9177 times |
Wed 15 October 2025 |
44.05 (5.41%) |
42.56 |
42.56 - 44.05 |
0.8149 times |
Tue 14 October 2025 |
41.79 (1.88%) |
40.98 |
40.98 - 42.85 |
0.8544 times |
Mon 13 October 2025 |
41.02 (2.83%) |
40.27 |
39.78 - 41.53 |
1.2342 times |
Fri 10 October 2025 |
39.89 (-1.14%) |
40.30 |
39.89 - 40.50 |
1.4399 times |
Thu 09 October 2025 |
40.35 (-1.08%) |
40.39 |
40.35 - 41.51 |
0.8623 times |
Wed 08 October 2025 |
40.79 (-0.37%) |
41.24 |
40.76 - 41.40 |
1.0285 times |
Tue 07 October 2025 |
40.94 (1.97%) |
40.15 |
40.15 - 41.58 |
0.7753 times |
Mon 06 October 2025 |
40.15 (-3.65%) |
42.00 |
40.13 - 42.00 |
0.6584 times |
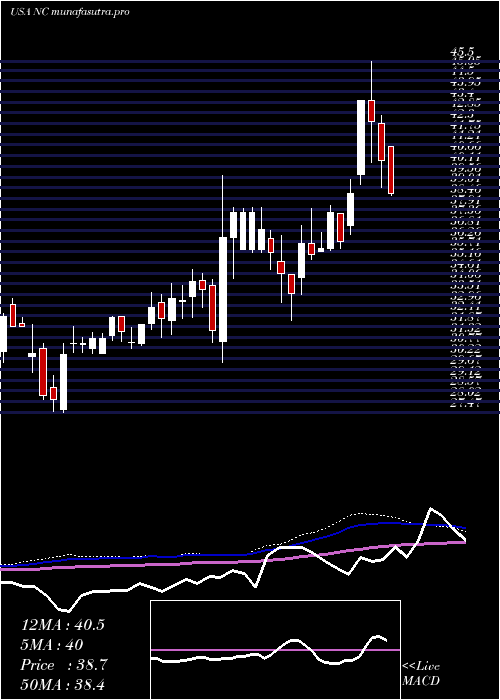
Weekly price and charts NaccoIndustries Strong weekly Stock price targets for NaccoIndustries NC are 44.24 and 45.66 | Weekly Target 1 | 43.06 | | Weekly Target 2 | 44 | | Weekly Target 3 | 44.476666666667 | | Weekly Target 4 | 45.42 | | Weekly Target 5 | 45.9 |
Weekly price and volumes for Nacco Industries
| Date |
Closing |
Open |
Range |
Volume |
Mon 20 October 2025 |
44.95 (0.45%) |
44.75 |
43.53 - 44.95 |
0.3518 times |
Fri 17 October 2025 |
44.75 (12.18%) |
40.27 |
39.78 - 44.95 |
1.3612 times |
Fri 10 October 2025 |
39.89 (-4.27%) |
42.00 |
39.89 - 42.00 |
1.3847 times |
Fri 03 October 2025 |
41.67 (-4.95%) |
43.44 |
40.78 - 44.30 |
1.0483 times |
Fri 26 September 2025 |
43.84 (4.63%) |
42.31 |
41.08 - 44.67 |
1.5244 times |
Fri 19 September 2025 |
41.90 (5.25%) |
39.69 |
39.69 - 44.06 |
1.6072 times |
Fri 12 September 2025 |
39.81 (4.87%) |
38.27 |
37.91 - 41.13 |
1.0301 times |
Fri 05 September 2025 |
37.96 (-2.97%) |
39.10 |
37.76 - 40.20 |
1.0117 times |
Fri 29 August 2025 |
39.12 (0%) |
39.01 |
38.68 - 39.14 |
0.0782 times |
Fri 29 August 2025 |
39.12 (1.9%) |
38.43 |
37.50 - 39.31 |
0.6024 times |
Fri 22 August 2025 |
38.39 (3.78%) |
37.30 |
35.43 - 39.76 |
0.853 times |
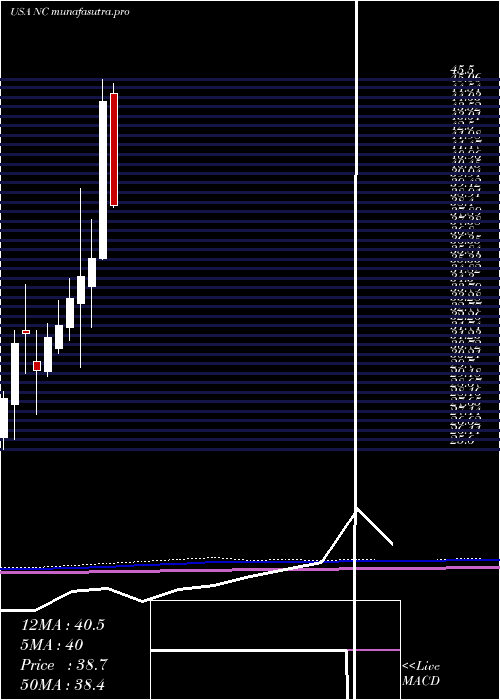
Monthly price and charts NaccoIndustries Strong monthly Stock price targets for NaccoIndustries NC are 42.37 and 47.54 | Monthly Target 1 | 38.06 | | Monthly Target 2 | 41.5 | | Monthly Target 3 | 43.226666666667 | | Monthly Target 4 | 46.67 | | Monthly Target 5 | 48.4 |
Monthly price and volumes Nacco Industries
| Date |
Closing |
Open |
Range |
Volume |
Mon 20 October 2025 |
44.95 (6.62%) |
42.23 |
39.78 - 44.95 |
0.773 times |
Tue 30 September 2025 |
42.16 (7.77%) |
39.10 |
37.76 - 44.67 |
1.2339 times |
Fri 29 August 2025 |
39.12 (3.16%) |
37.44 |
35.43 - 39.91 |
0.606 times |
Thu 31 July 2025 |
37.92 (-14.42%) |
44.77 |
37.63 - 45.27 |
0.7434 times |
Mon 30 June 2025 |
44.31 (23.56%) |
35.86 |
35.80 - 45.50 |
1.0427 times |
Fri 30 May 2025 |
35.86 (2.75%) |
34.36 |
32.16 - 37.95 |
0.9209 times |
Wed 30 April 2025 |
34.90 (3.47%) |
33.44 |
30.00 - 39.65 |
1.8085 times |
Mon 31 March 2025 |
33.73 (4.49%) |
32.17 |
31.46 - 34.78 |
1.0323 times |
Fri 28 February 2025 |
32.28 (2.06%) |
31.05 |
30.75 - 33.60 |
0.8076 times |
Fri 31 January 2025 |
31.63 (6.07%) |
29.78 |
29.54 - 32.40 |
1.0317 times |
Tue 31 December 2024 |
29.82 (-6.4%) |
30.32 |
27.47 - 31.99 |
1.0234 times |
DMA SMA EMA moving averages of Nacco Industries NC
DMA (daily moving average) of Nacco Industries NC
| DMA period | DMA value | | 5 day DMA | 44 | | 12 day DMA | 42.07 | | 20 day DMA | 42.23 | | 35 day DMA | 41.41 | | 50 day DMA | 40.27 | | 100 day DMA | 39.7 | | 150 day DMA | 38.13 | | 200 day DMA | 36.57 | EMA (exponential moving average) of Nacco Industries NC
| EMA period | EMA current | EMA prev | EMA prev2 | | 5 day EMA | 43.97 | 43.48 | 42.85 | | 12 day EMA | 42.84 | 42.46 | 42.04 | | 20 day EMA | 42.24 | 41.95 | 41.65 | | 35 day EMA | 41.23 | 41.01 | 40.79 | | 50 day EMA | 40.42 | 40.23 | 40.05 |
SMA (simple moving average) of Nacco Industries NC
| SMA period | SMA current | SMA prev | SMA prev2 | | 5 day SMA | 44 | 43.21 | 42.24 | | 12 day SMA | 42.07 | 41.77 | 41.54 | | 20 day SMA | 42.23 | 42.05 | 41.91 | | 35 day SMA | 41.41 | 41.24 | 41.08 | | 50 day SMA | 40.27 | 40.1 | 39.95 | | 100 day SMA | 39.7 | 39.61 | 39.52 | | 150 day SMA | 38.13 | 38.05 | 37.97 | | 200 day SMA | 36.57 | 36.5 | 36.42 |
|
|
