NbtBancorp NBTB full analysis,charts,indicators,moving averages,SMA,DMA,EMA,ADX,MACD,RSINbt Bancorp NBTB WideScreen charts, DMA,SMA,EMA technical analysis, forecast prediction, by indicators ADX,MACD,RSI,CCI USA stock exchange
operates under Finance sector & deals in Major Banks
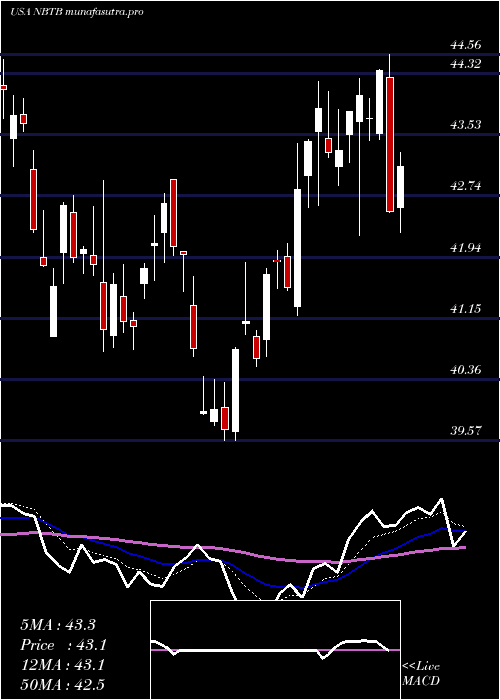
Daily price and charts and targets NbtBancorp Strong Daily Stock price targets for NbtBancorp NBTB are 41.56 and 42.04 | Daily Target 1 | 41.47 | | Daily Target 2 | 41.64 | | Daily Target 3 | 41.946666666667 | | Daily Target 4 | 42.12 | | Daily Target 5 | 42.43 |
Daily price and volume Nbt Bancorp
| Date |
Closing |
Open |
Range |
Volume |
Thu 04 December 2025 |
41.82 (-0.99%) |
42.04 |
41.77 - 42.25 |
0.5906 times |
Wed 03 December 2025 |
42.24 (1.69%) |
41.75 |
41.60 - 42.58 |
1.0159 times |
Tue 02 December 2025 |
41.54 (0%) |
41.83 |
41.27 - 41.96 |
0.6739 times |
Mon 01 December 2025 |
41.54 (0.19%) |
40.86 |
40.80 - 41.78 |
1.0494 times |
Fri 28 November 2025 |
41.46 (-1.61%) |
42.13 |
41.34 - 42.23 |
0.9225 times |
Wed 26 November 2025 |
42.14 (-0.5%) |
42.08 |
41.93 - 42.69 |
1.8031 times |
Tue 25 November 2025 |
42.35 (2.94%) |
41.44 |
41.38 - 42.86 |
1.1186 times |
Mon 24 November 2025 |
41.14 (-0.34%) |
41.15 |
40.78 - 41.41 |
1.1085 times |
Fri 21 November 2025 |
41.28 (3.3%) |
40.04 |
39.90 - 41.77 |
1.0137 times |
Thu 20 November 2025 |
39.96 (0.88%) |
40.00 |
39.79 - 40.93 |
0.7039 times |
Wed 19 November 2025 |
39.61 (-0.4%) |
39.68 |
39.52 - 40.02 |
0.9705 times |
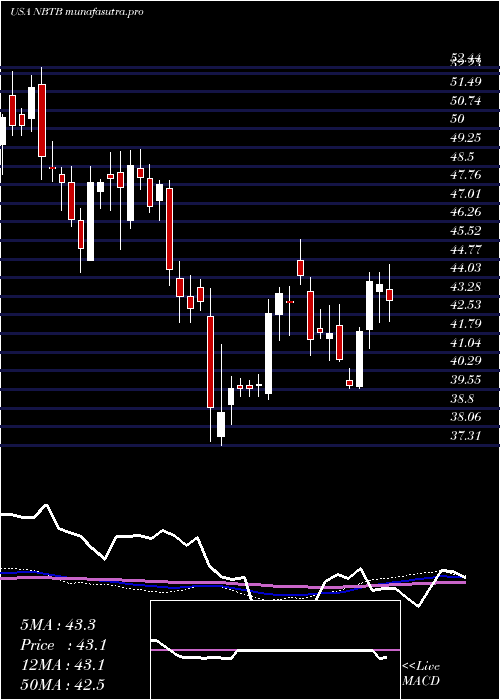
Weekly price and charts NbtBancorp Strong weekly Stock price targets for NbtBancorp NBTB are 41.31 and 43.09 | Weekly Target 1 | 39.95 | | Weekly Target 2 | 40.89 | | Weekly Target 3 | 41.733333333333 | | Weekly Target 4 | 42.67 | | Weekly Target 5 | 43.51 |
Weekly price and volumes for Nbt Bancorp
| Date |
Closing |
Open |
Range |
Volume |
Thu 04 December 2025 |
41.82 (0.87%) |
40.86 |
40.80 - 42.58 |
0.8422 times |
Fri 28 November 2025 |
41.46 (0.44%) |
41.15 |
40.78 - 42.86 |
1.2526 times |
Fri 21 November 2025 |
41.28 (0.86%) |
40.94 |
39.45 - 41.77 |
1.0932 times |
Fri 14 November 2025 |
40.93 (-1.63%) |
41.81 |
40.26 - 42.40 |
0.9891 times |
Fri 07 November 2025 |
41.61 (2.82%) |
40.64 |
40.37 - 41.98 |
1.065 times |
Fri 31 October 2025 |
40.47 (0%) |
40.48 |
39.93 - 40.76 |
0.2836 times |
Fri 31 October 2025 |
40.47 (-1.1%) |
40.95 |
39.76 - 42.00 |
1.5075 times |
Fri 24 October 2025 |
40.92 (1.92%) |
40.40 |
40.01 - 41.30 |
0.8413 times |
Fri 17 October 2025 |
40.15 (2.24%) |
39.76 |
39.20 - 42.47 |
1.347 times |
Fri 10 October 2025 |
39.27 (-5.31%) |
41.80 |
39.20 - 42.27 |
0.7786 times |
Fri 03 October 2025 |
41.47 (-2.52%) |
42.60 |
40.90 - 42.60 |
0.8624 times |
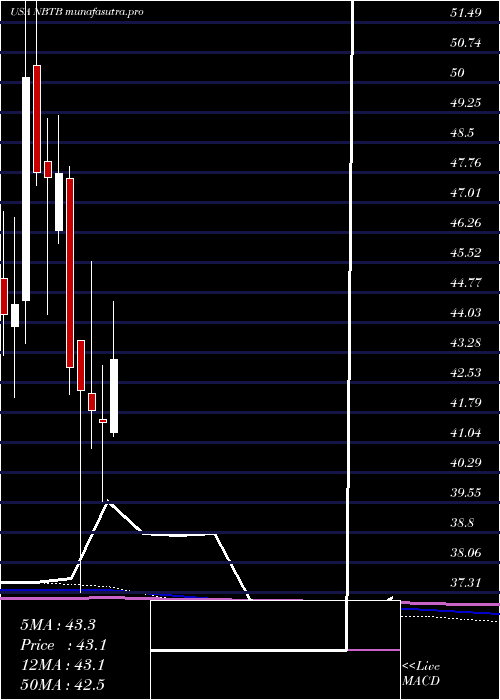
Monthly price and charts NbtBancorp Strong monthly Stock price targets for NbtBancorp NBTB are 41.31 and 43.09 | Monthly Target 1 | 39.95 | | Monthly Target 2 | 40.89 | | Monthly Target 3 | 41.733333333333 | | Monthly Target 4 | 42.67 | | Monthly Target 5 | 43.51 |
Monthly price and volumes Nbt Bancorp
| Date |
Closing |
Open |
Range |
Volume |
Thu 04 December 2025 |
41.82 (0.87%) |
40.86 |
40.80 - 42.58 |
0.1712 times |
Fri 28 November 2025 |
41.46 (2.45%) |
40.64 |
39.45 - 42.86 |
0.8946 times |
Fri 31 October 2025 |
40.47 (-3.09%) |
41.40 |
39.20 - 42.47 |
1.0693 times |
Tue 30 September 2025 |
41.76 (-5.67%) |
43.85 |
41.08 - 45.28 |
0.8639 times |
Fri 29 August 2025 |
44.27 (6.98%) |
41.02 |
40.08 - 45.28 |
0.8514 times |
Thu 31 July 2025 |
41.38 (-0.41%) |
41.30 |
41.07 - 44.56 |
1.0502 times |
Mon 30 June 2025 |
41.55 (-0.72%) |
41.61 |
39.57 - 42.95 |
0.9539 times |
Fri 30 May 2025 |
41.85 (-1.16%) |
42.26 |
40.91 - 45.56 |
1.5588 times |
Wed 30 April 2025 |
42.34 (-1.31%) |
43.57 |
37.31 - 43.59 |
1.4179 times |
Mon 31 March 2025 |
42.90 (-10.16%) |
47.61 |
42.24 - 47.92 |
1.1687 times |
Fri 28 February 2025 |
47.75 (0.25%) |
46.32 |
46.01 - 49.18 |
0.6522 times |
DMA SMA EMA moving averages of Nbt Bancorp NBTB
DMA (daily moving average) of Nbt Bancorp NBTB
| DMA period | DMA value | | 5 day DMA | 41.72 | | 12 day DMA | 41.24 | | 20 day DMA | 41.18 | | 35 day DMA | 40.94 | | 50 day DMA | 41.06 | | 100 day DMA | 41.98 | | 150 day DMA | 42.14 | | 200 day DMA | 42.32 | EMA (exponential moving average) of Nbt Bancorp NBTB
| EMA period | EMA current | EMA prev | EMA prev2 | | 5 day EMA | 41.79 | 41.77 | 41.53 | | 12 day EMA | 41.49 | 41.43 | 41.28 | | 20 day EMA | 41.31 | 41.26 | 41.16 | | 35 day EMA | 41.29 | 41.26 | 41.2 | | 50 day EMA | 41.3 | 41.28 | 41.24 |
SMA (simple moving average) of Nbt Bancorp NBTB
| SMA period | SMA current | SMA prev | SMA prev2 | | 5 day SMA | 41.72 | 41.78 | 41.81 | | 12 day SMA | 41.24 | 41.06 | 40.95 | | 20 day SMA | 41.18 | 41.18 | 41.1 | | 35 day SMA | 40.94 | 40.92 | 40.92 | | 50 day SMA | 41.06 | 41.08 | 41.09 | | 100 day SMA | 41.98 | 41.98 | 42 | | 150 day SMA | 42.14 | 42.14 | 42.15 | | 200 day SMA | 42.32 | 42.35 | 42.38 |
|
|
