NortheastBancorp NBN full analysis,charts,indicators,moving averages,SMA,DMA,EMA,ADX,MACD,RSINortheast Bancorp NBN WideScreen charts, DMA,SMA,EMA technical analysis, forecast prediction, by indicators ADX,MACD,RSI,CCI USA stock exchange
operates under Finance sector & deals in Major Banks
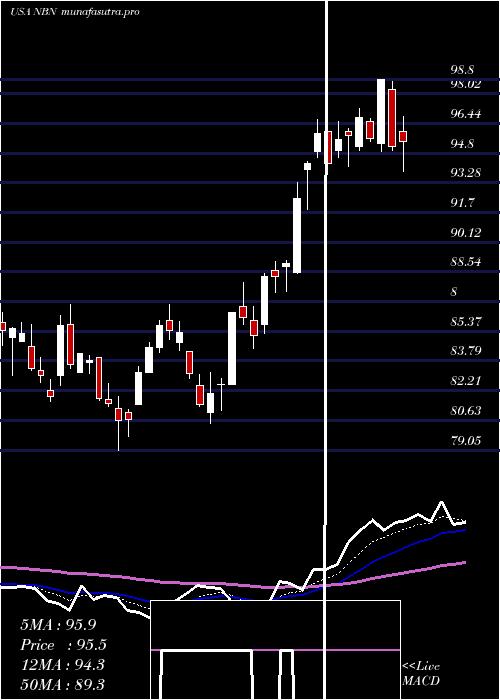
Daily price and charts and targets NortheastBancorp Strong Daily Stock price targets for NortheastBancorp NBN are 91.65 and 93.2 | Daily Target 1 | 90.45 | | Daily Target 2 | 91.29 | | Daily Target 3 | 92 | | Daily Target 4 | 92.84 | | Daily Target 5 | 93.55 |
Daily price and volume Northeast Bancorp
| Date |
Closing |
Open |
Range |
Volume |
Fri 05 December 2025 |
92.13 (-0.5%) |
92.03 |
91.16 - 92.71 |
0.7319 times |
Thu 04 December 2025 |
92.59 (0.41%) |
91.51 |
90.74 - 93.14 |
0.7662 times |
Wed 03 December 2025 |
92.21 (3.1%) |
89.50 |
89.45 - 92.21 |
0.8786 times |
Tue 02 December 2025 |
89.44 (-1.37%) |
91.36 |
89.12 - 92.84 |
1.0861 times |
Mon 01 December 2025 |
90.68 (2.03%) |
88.08 |
87.93 - 91.13 |
0.9129 times |
Fri 28 November 2025 |
88.88 (0.78%) |
88.71 |
87.27 - 89.15 |
0.4682 times |
Wed 26 November 2025 |
88.19 (0.98%) |
86.63 |
86.63 - 88.40 |
0.902 times |
Tue 25 November 2025 |
87.33 (4.1%) |
84.25 |
84.25 - 87.81 |
0.8458 times |
Mon 24 November 2025 |
83.89 (-0.78%) |
84.09 |
83.01 - 86.17 |
1.4217 times |
Fri 21 November 2025 |
84.55 (3.34%) |
82.14 |
82.14 - 86.76 |
1.9866 times |
Thu 20 November 2025 |
81.82 (-1.05%) |
83.33 |
80.75 - 84.89 |
1.161 times |
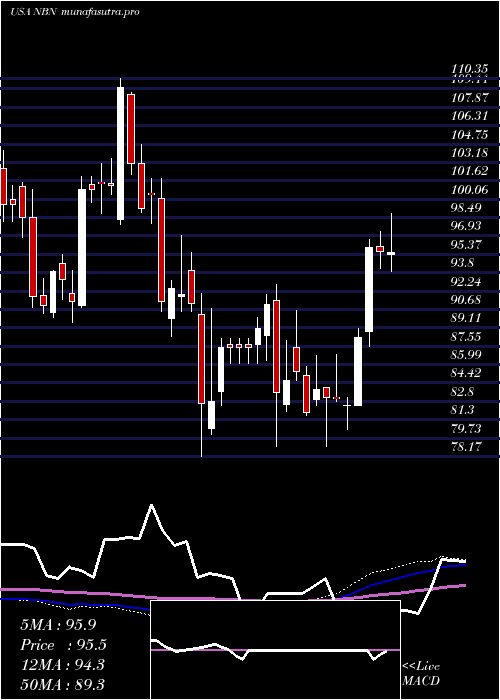
Weekly price and charts NortheastBancorp Strong weekly Stock price targets for NortheastBancorp NBN are 90.03 and 95.24 | Weekly Target 1 | 85.86 | | Weekly Target 2 | 88.99 | | Weekly Target 3 | 91.066666666667 | | Weekly Target 4 | 94.2 | | Weekly Target 5 | 96.28 |
Weekly price and volumes for Northeast Bancorp
| Date |
Closing |
Open |
Range |
Volume |
Fri 05 December 2025 |
92.13 (3.66%) |
88.08 |
87.93 - 93.14 |
1.03 times |
Fri 28 November 2025 |
88.88 (5.12%) |
84.09 |
83.01 - 89.15 |
0.8563 times |
Fri 21 November 2025 |
84.55 (-0.95%) |
84.78 |
80.75 - 86.76 |
1.465 times |
Fri 14 November 2025 |
85.36 (0.13%) |
85.66 |
83.00 - 87.21 |
1.0951 times |
Fri 07 November 2025 |
85.25 (-1.19%) |
87.01 |
82.79 - 87.35 |
0.6877 times |
Fri 31 October 2025 |
86.28 (0%) |
85.63 |
85.50 - 88.51 |
0.2171 times |
Fri 31 October 2025 |
86.28 (-11.33%) |
97.43 |
85.50 - 97.80 |
1.1722 times |
Fri 24 October 2025 |
97.31 (7.48%) |
91.50 |
91.17 - 97.67 |
0.8258 times |
Fri 17 October 2025 |
90.54 (-0.97%) |
93.25 |
88.91 - 97.16 |
1.3849 times |
Fri 10 October 2025 |
91.43 (-3.4%) |
95.60 |
91.41 - 98.14 |
1.2659 times |
Fri 03 October 2025 |
94.65 (-7.79%) |
103.69 |
92.90 - 104.10 |
1.4627 times |
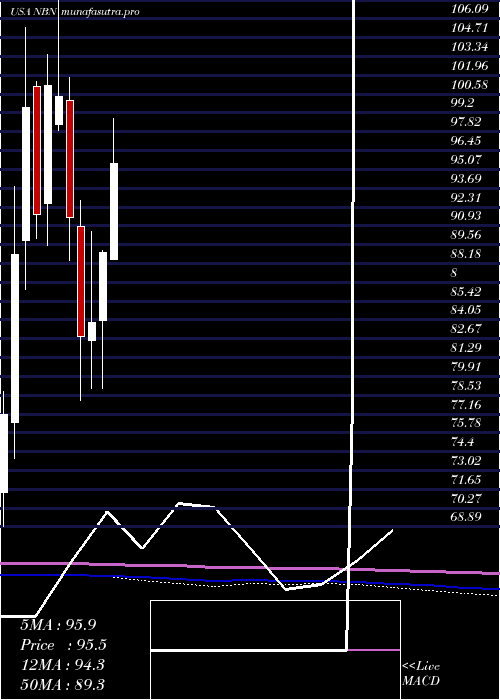
Monthly price and charts NortheastBancorp Strong monthly Stock price targets for NortheastBancorp NBN are 90.03 and 95.24 | Monthly Target 1 | 85.86 | | Monthly Target 2 | 88.99 | | Monthly Target 3 | 91.066666666667 | | Monthly Target 4 | 94.2 | | Monthly Target 5 | 96.28 |
Monthly price and volumes Northeast Bancorp
| Date |
Closing |
Open |
Range |
Volume |
Fri 05 December 2025 |
92.13 (3.66%) |
88.08 |
87.93 - 93.14 |
0.2092 times |
Fri 28 November 2025 |
88.88 (3.01%) |
87.01 |
80.75 - 89.15 |
0.8336 times |
Fri 31 October 2025 |
86.28 (-13.86%) |
99.41 |
85.50 - 100.14 |
1.1527 times |
Tue 30 September 2025 |
100.16 (-9.41%) |
109.24 |
99.50 - 113.01 |
1.3658 times |
Fri 29 August 2025 |
110.56 (11.49%) |
97.34 |
92.33 - 111.50 |
1.4066 times |
Thu 31 July 2025 |
99.17 (11.44%) |
88.50 |
88.45 - 105.50 |
1.7733 times |
Mon 30 June 2025 |
88.99 (6.16%) |
84.00 |
79.05 - 89.15 |
1.3748 times |
Fri 30 May 2025 |
83.83 (1.22%) |
82.53 |
79.05 - 90.55 |
0.6117 times |
Wed 30 April 2025 |
82.82 (-9.53%) |
90.86 |
78.17 - 92.77 |
0.6202 times |
Mon 31 March 2025 |
91.54 (-8.84%) |
100.08 |
88.36 - 101.81 |
0.6522 times |
Fri 28 February 2025 |
100.42 (-0.77%) |
98.33 |
97.89 - 110.35 |
0.7209 times |
DMA SMA EMA moving averages of Northeast Bancorp NBN
DMA (daily moving average) of Northeast Bancorp NBN
| DMA period | DMA value | | 5 day DMA | 91.41 | | 12 day DMA | 87.87 | | 20 day DMA | 86.5 | | 35 day DMA | 88.38 | | 50 day DMA | 90.59 | | 100 day DMA | 97.29 | | 150 day DMA | 93.81 | | 200 day DMA | 93.07 | EMA (exponential moving average) of Northeast Bancorp NBN
| EMA period | EMA current | EMA prev | EMA prev2 | | 5 day EMA | 91.2 | 90.73 | 89.8 | | 12 day EMA | 89.13 | 88.58 | 87.85 | | 20 day EMA | 88.56 | 88.18 | 87.72 | | 35 day EMA | 89.93 | 89.8 | 89.64 | | 50 day EMA | 92.05 | 92.05 | 92.03 |
SMA (simple moving average) of Northeast Bancorp NBN
| SMA period | SMA current | SMA prev | SMA prev2 | | 5 day SMA | 91.41 | 90.76 | 89.88 | | 12 day SMA | 87.87 | 87.11 | 86.2 | | 20 day SMA | 86.5 | 86.1 | 85.79 | | 35 day SMA | 88.38 | 88.32 | 88.35 | | 50 day SMA | 90.59 | 90.81 | 91.11 | | 100 day SMA | 97.29 | 97.33 | 97.35 | | 150 day SMA | 93.81 | 93.75 | 93.68 | | 200 day SMA | 93.07 | 93.13 | 93.18 |
|
|
