NationalBank NBHC full analysis,charts,indicators,moving averages,SMA,DMA,EMA,ADX,MACD,RSINational Bank NBHC WideScreen charts, DMA,SMA,EMA technical analysis, forecast prediction, by indicators ADX,MACD,RSI,CCI USA stock exchange
operates under Finance sector & deals in Major Banks
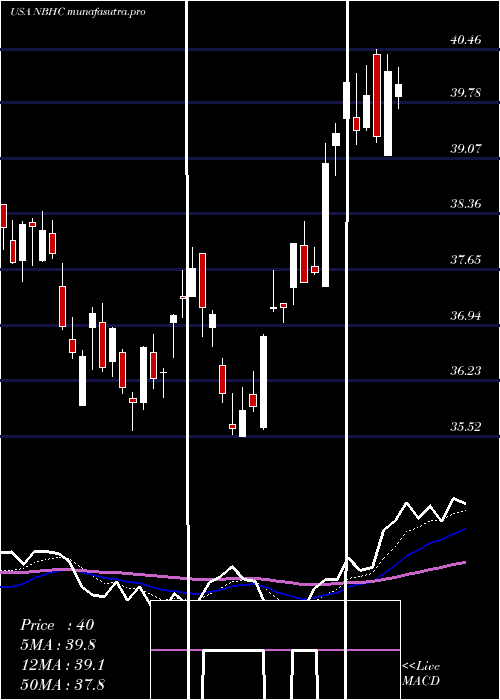
Daily price and charts and targets NationalBank Strong Daily Stock price targets for NationalBank NBHC are 38.4 and 38.89 | Daily Target 1 | 38 | | Daily Target 2 | 38.31 | | Daily Target 3 | 38.493333333333 | | Daily Target 4 | 38.8 | | Daily Target 5 | 38.98 |
Daily price and volume National Bank
| Date |
Closing |
Open |
Range |
Volume |
Thu 04 December 2025 |
38.61 (0.55%) |
38.19 |
38.19 - 38.68 |
0.7303 times |
Wed 03 December 2025 |
38.40 (2.37%) |
37.66 |
37.64 - 38.60 |
0.9342 times |
Tue 02 December 2025 |
37.51 (0.13%) |
37.66 |
37.24 - 37.79 |
1.3639 times |
Mon 01 December 2025 |
37.46 (0.67%) |
37.08 |
36.86 - 37.60 |
1.1249 times |
Fri 28 November 2025 |
37.21 (-1.22%) |
37.49 |
37.08 - 37.49 |
0.5255 times |
Wed 26 November 2025 |
37.67 (-0.87%) |
37.77 |
37.67 - 38.17 |
1.6453 times |
Tue 25 November 2025 |
38.00 (2.76%) |
37.15 |
37.15 - 38.26 |
0.8832 times |
Mon 24 November 2025 |
36.98 (0.03%) |
36.95 |
36.38 - 37.23 |
1.0804 times |
Fri 21 November 2025 |
36.97 (3.67%) |
35.87 |
35.76 - 37.34 |
1.0084 times |
Thu 20 November 2025 |
35.66 (-0.2%) |
36.00 |
35.54 - 36.72 |
0.7038 times |
Wed 19 November 2025 |
35.73 (0.25%) |
35.63 |
35.50 - 36.36 |
3.0606 times |
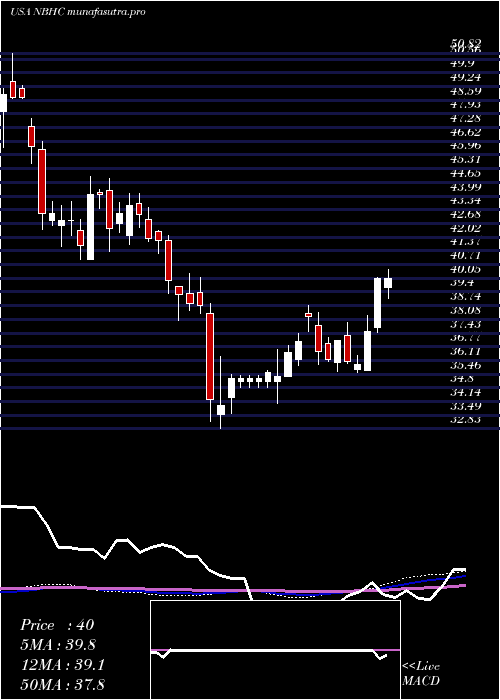
Weekly price and charts NationalBank Strong weekly Stock price targets for NationalBank NBHC are 37.74 and 39.56 | Weekly Target 1 | 36.23 | | Weekly Target 2 | 37.42 | | Weekly Target 3 | 38.05 | | Weekly Target 4 | 39.24 | | Weekly Target 5 | 39.87 |
Weekly price and volumes for National Bank
| Date |
Closing |
Open |
Range |
Volume |
Thu 04 December 2025 |
38.61 (3.76%) |
37.08 |
36.86 - 38.68 |
0.9484 times |
Fri 28 November 2025 |
37.21 (0.65%) |
36.95 |
36.38 - 38.26 |
0.9441 times |
Fri 21 November 2025 |
36.97 (0.65%) |
36.58 |
35.50 - 37.34 |
1.5559 times |
Fri 14 November 2025 |
36.73 (1.07%) |
36.56 |
36.22 - 37.67 |
0.8779 times |
Fri 07 November 2025 |
36.34 (1.91%) |
35.73 |
35.47 - 36.68 |
0.854 times |
Fri 31 October 2025 |
35.66 (0%) |
35.76 |
35.26 - 35.91 |
0.2033 times |
Fri 31 October 2025 |
35.66 (-4.91%) |
37.59 |
35.26 - 37.83 |
1.072 times |
Fri 24 October 2025 |
37.50 (3.11%) |
36.54 |
36.49 - 38.31 |
1.4842 times |
Fri 17 October 2025 |
36.37 (-6.09%) |
36.91 |
35.39 - 38.43 |
1.5285 times |
Tue 07 October 2025 |
38.73 (1.18%) |
38.73 |
38.13 - 39.26 |
0.5318 times |
Fri 03 October 2025 |
38.28 (-3.01%) |
39.49 |
37.97 - 39.49 |
1.4132 times |
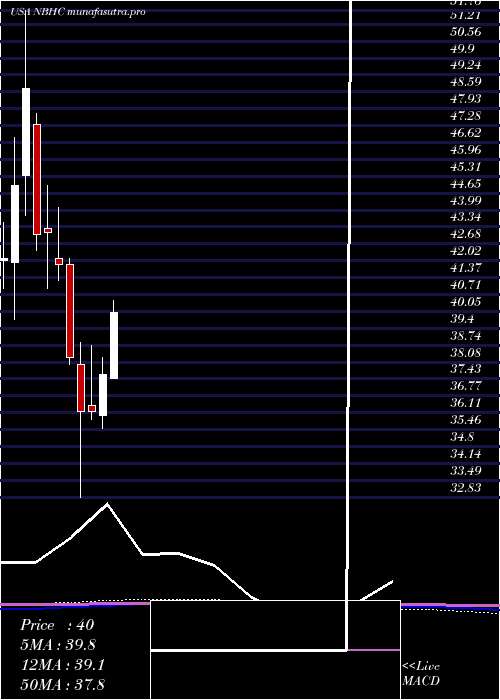
Monthly price and charts NationalBank Strong monthly Stock price targets for NationalBank NBHC are 37.74 and 39.56 | Monthly Target 1 | 36.23 | | Monthly Target 2 | 37.42 | | Monthly Target 3 | 38.05 | | Monthly Target 4 | 39.24 | | Monthly Target 5 | 39.87 |
Monthly price and volumes National Bank
| Date |
Closing |
Open |
Range |
Volume |
Thu 04 December 2025 |
38.61 (3.76%) |
37.08 |
36.86 - 38.68 |
0.2105 times |
Fri 28 November 2025 |
37.21 (4.35%) |
35.73 |
35.47 - 38.26 |
0.9393 times |
Fri 31 October 2025 |
35.66 (-7.71%) |
38.34 |
35.26 - 39.32 |
1.2559 times |
Tue 30 September 2025 |
38.64 (-1.48%) |
38.70 |
36.93 - 41.71 |
1.4722 times |
Fri 29 August 2025 |
39.22 (5.83%) |
36.79 |
35.40 - 39.99 |
1.2211 times |
Thu 31 July 2025 |
37.06 (-1.46%) |
37.43 |
37.02 - 40.57 |
1.1803 times |
Mon 30 June 2025 |
37.61 (4.04%) |
36.01 |
35.52 - 38.26 |
0.782 times |
Fri 30 May 2025 |
36.15 (-0.03%) |
36.41 |
35.86 - 38.72 |
0.7738 times |
Wed 30 April 2025 |
36.16 (-5.51%) |
38.00 |
32.83 - 38.84 |
1.1079 times |
Mon 31 March 2025 |
38.27 (-8.6%) |
41.87 |
38.00 - 42.09 |
1.057 times |
Fri 28 February 2025 |
41.87 (-2.92%) |
42.11 |
41.24 - 44.11 |
0.5615 times |
DMA SMA EMA moving averages of National Bank NBHC
DMA (daily moving average) of National Bank NBHC
| DMA period | DMA value | | 5 day DMA | 37.84 | | 12 day DMA | 37.15 | | 20 day DMA | 36.93 | | 35 day DMA | 36.75 | | 50 day DMA | 37.32 | | 100 day DMA | 37.98 | | 150 day DMA | 37.74 | | 200 day DMA | 37.88 | EMA (exponential moving average) of National Bank NBHC
| EMA period | EMA current | EMA prev | EMA prev2 | | 5 day EMA | 38.01 | 37.71 | 37.37 | | 12 day EMA | 37.46 | 37.25 | 37.04 | | 20 day EMA | 37.23 | 37.08 | 36.94 | | 35 day EMA | 37.34 | 37.26 | 37.19 | | 50 day EMA | 37.52 | 37.48 | 37.44 |
SMA (simple moving average) of National Bank NBHC
| SMA period | SMA current | SMA prev | SMA prev2 | | 5 day SMA | 37.84 | 37.65 | 37.57 | | 12 day SMA | 37.15 | 36.9 | 36.76 | | 20 day SMA | 36.93 | 36.81 | 36.69 | | 35 day SMA | 36.75 | 36.73 | 36.72 | | 50 day SMA | 37.32 | 37.34 | 37.41 | | 100 day SMA | 37.98 | 38 | 38.01 | | 150 day SMA | 37.74 | 37.72 | 37.7 | | 200 day SMA | 37.88 | 37.9 | 37.92 |
|
|
