NaturalAlternatives NAII full analysis,charts,indicators,moving averages,SMA,DMA,EMA,ADX,MACD,RSINatural Alternatives NAII WideScreen charts, DMA,SMA,EMA technical analysis, forecast prediction, by indicators ADX,MACD,RSI,CCI USA stock exchange
operates under Consumer Durables sector & deals in Specialty Chemicals
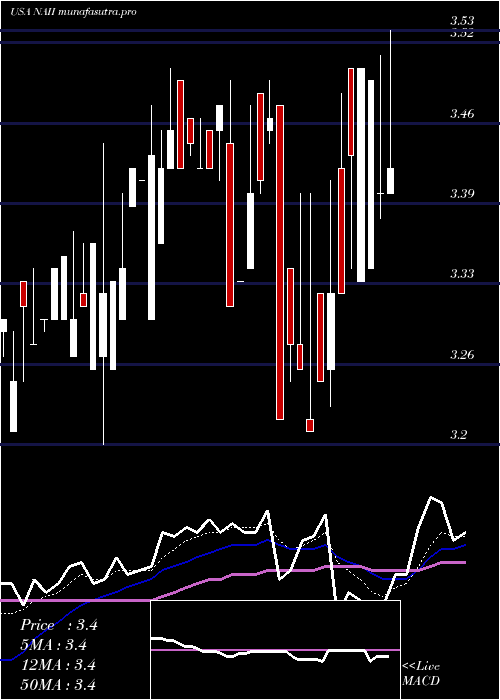
Daily price and charts and targets NaturalAlternatives Strong Daily Stock price targets for NaturalAlternatives NAII are 2.65 and 2.79 | Daily Target 1 | 2.54 | | Daily Target 2 | 2.62 | | Daily Target 3 | 2.68 | | Daily Target 4 | 2.76 | | Daily Target 5 | 2.82 |
Daily price and volume Natural Alternatives
| Date |
Closing |
Open |
Range |
Volume |
Mon 20 October 2025 |
2.70 (2.66%) |
2.62 |
2.60 - 2.74 |
1.1544 times |
Fri 17 October 2025 |
2.63 (-2.23%) |
2.67 |
2.60 - 2.68 |
1.6968 times |
Thu 16 October 2025 |
2.69 (-2.18%) |
2.69 |
2.61 - 2.77 |
1.2378 times |
Wed 15 October 2025 |
2.75 (3.38%) |
2.68 |
2.64 - 2.78 |
1.1057 times |
Tue 14 October 2025 |
2.66 (-2.21%) |
2.72 |
2.65 - 2.77 |
0.2712 times |
Mon 13 October 2025 |
2.72 (2.26%) |
2.69 |
2.69 - 2.84 |
0.5841 times |
Fri 10 October 2025 |
2.66 (-6.34%) |
2.75 |
2.65 - 2.90 |
0.4798 times |
Thu 09 October 2025 |
2.84 (5.97%) |
2.67 |
2.67 - 2.84 |
0.9388 times |
Wed 08 October 2025 |
2.68 (-1.11%) |
2.70 |
2.67 - 2.80 |
0.9179 times |
Tue 07 October 2025 |
2.71 (-1.81%) |
2.83 |
2.70 - 2.88 |
1.6134 times |
Mon 06 October 2025 |
2.76 (-2.13%) |
2.88 |
2.76 - 2.90 |
0.9666 times |
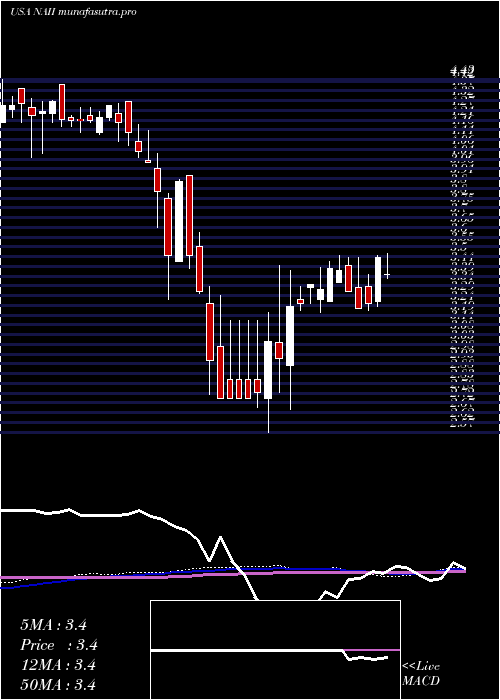
Weekly price and charts NaturalAlternatives Strong weekly Stock price targets for NaturalAlternatives NAII are 2.65 and 2.79 | Weekly Target 1 | 2.54 | | Weekly Target 2 | 2.62 | | Weekly Target 3 | 2.68 | | Weekly Target 4 | 2.76 | | Weekly Target 5 | 2.82 |
Weekly price and volumes for Natural Alternatives
| Date |
Closing |
Open |
Range |
Volume |
Mon 20 October 2025 |
2.70 (2.66%) |
2.62 |
2.60 - 2.74 |
0.4241 times |
Fri 17 October 2025 |
2.63 (-1.13%) |
2.69 |
2.60 - 2.84 |
1.7986 times |
Fri 10 October 2025 |
2.66 (-5.67%) |
2.88 |
2.65 - 2.90 |
1.8062 times |
Fri 03 October 2025 |
2.82 (-2.08%) |
2.93 |
2.73 - 2.93 |
1.3213 times |
Fri 26 September 2025 |
2.88 (-7.69%) |
3.15 |
2.87 - 3.30 |
1.0066 times |
Fri 19 September 2025 |
3.12 (-10.86%) |
3.45 |
2.89 - 3.45 |
0.7511 times |
Fri 12 September 2025 |
3.50 (-2.78%) |
3.83 |
3.28 - 3.87 |
1.165 times |
Fri 05 September 2025 |
3.60 (-3.49%) |
3.63 |
3.60 - 3.93 |
0.1993 times |
Thu 28 August 2025 |
3.73 (-6.28%) |
3.90 |
3.58 - 3.97 |
1.1701 times |
Fri 22 August 2025 |
3.98 (3.65%) |
3.85 |
3.85 - 4.03 |
0.3577 times |
Fri 15 August 2025 |
3.84 (3.78%) |
3.62 |
3.62 - 3.90 |
0.4803 times |
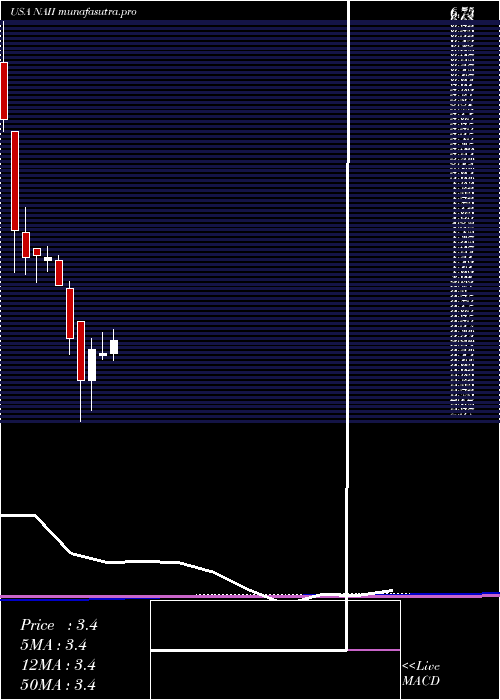
Monthly price and charts NaturalAlternatives Strong monthly Stock price targets for NaturalAlternatives NAII are 2.49 and 2.81 | Monthly Target 1 | 2.42 | | Monthly Target 2 | 2.56 | | Monthly Target 3 | 2.74 | | Monthly Target 4 | 2.88 | | Monthly Target 5 | 3.06 |
Monthly price and volumes Natural Alternatives
| Date |
Closing |
Open |
Range |
Volume |
Mon 20 October 2025 |
2.70 (-5.26%) |
2.77 |
2.60 - 2.92 |
1.2716 times |
Tue 30 September 2025 |
2.85 (-23.59%) |
3.63 |
2.74 - 3.93 |
0.8356 times |
Thu 28 August 2025 |
3.73 (2.75%) |
3.62 |
3.58 - 4.03 |
0.5433 times |
Thu 31 July 2025 |
3.63 (10.67%) |
3.28 |
3.21 - 3.80 |
0.5791 times |
Mon 30 June 2025 |
3.28 (-1.2%) |
3.26 |
3.22 - 3.50 |
0.5077 times |
Fri 30 May 2025 |
3.32 (10.67%) |
3.00 |
2.69 - 3.44 |
1.2333 times |
Wed 30 April 2025 |
3.00 (-12.79%) |
3.62 |
2.57 - 3.62 |
2.4986 times |
Mon 31 March 2025 |
3.44 (-13.78%) |
3.96 |
3.27 - 4.04 |
1.2942 times |
Thu 27 February 2025 |
3.99 (-6.99%) |
4.25 |
3.99 - 4.31 |
0.5547 times |
Fri 31 January 2025 |
4.29 (-0.46%) |
4.25 |
4.14 - 4.40 |
0.682 times |
Tue 31 December 2024 |
4.31 (0.47%) |
4.38 |
4.02 - 4.38 |
0.7999 times |
DMA SMA EMA moving averages of Natural Alternatives NAII
DMA (daily moving average) of Natural Alternatives NAII
| DMA period | DMA value | | 5 day DMA | 2.69 | | 12 day DMA | 2.72 | | 20 day DMA | 2.8 | | 35 day DMA | 3.05 | | 50 day DMA | 3.28 | | 100 day DMA | 3.36 | | 150 day DMA | 3.29 | | 200 day DMA | 3.5 | EMA (exponential moving average) of Natural Alternatives NAII
| EMA period | EMA current | EMA prev | EMA prev2 | | 5 day EMA | 2.69 | 2.68 | 2.71 | | 12 day EMA | 2.74 | 2.75 | 2.77 | | 20 day EMA | 2.84 | 2.85 | 2.87 | | 35 day EMA | 3.03 | 3.05 | 3.07 | | 50 day EMA | 3.25 | 3.27 | 3.3 |
SMA (simple moving average) of Natural Alternatives NAII
| SMA period | SMA current | SMA prev | SMA prev2 | | 5 day SMA | 2.69 | 2.69 | 2.7 | | 12 day SMA | 2.72 | 2.72 | 2.75 | | 20 day SMA | 2.8 | 2.82 | 2.85 | | 35 day SMA | 3.05 | 3.08 | 3.1 | | 50 day SMA | 3.28 | 3.3 | 3.32 | | 100 day SMA | 3.36 | 3.36 | 3.37 | | 150 day SMA | 3.29 | 3.29 | 3.3 | | 200 day SMA | 3.5 | 3.51 | 3.51 |
|
|
