MaxlinearInc MXL full analysis,charts,indicators,moving averages,SMA,DMA,EMA,ADX,MACD,RSIMaxlinear Inc MXL WideScreen charts, DMA,SMA,EMA technical analysis, forecast prediction, by indicators ADX,MACD,RSI,CCI USA stock exchange
operates under Technology sector & deals in Semiconductors
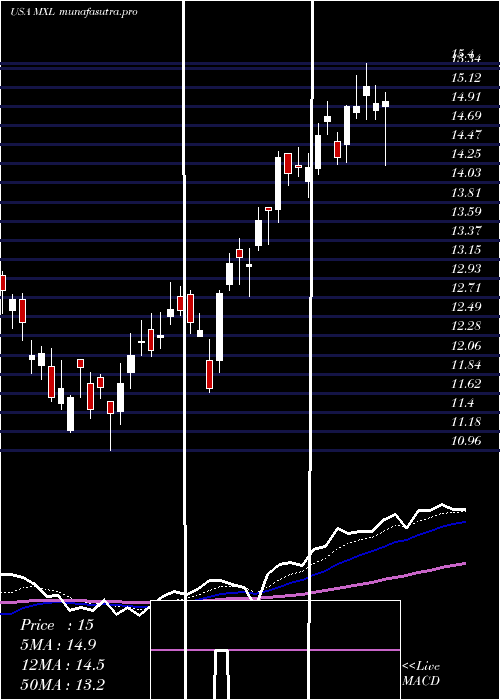
Daily price and charts and targets MaxlinearInc Strong Daily Stock price targets for MaxlinearInc MXL are 17.35 and 18.05 | Daily Target 1 | 16.78 | | Daily Target 2 | 17.21 | | Daily Target 3 | 17.48 | | Daily Target 4 | 17.91 | | Daily Target 5 | 18.18 |
Daily price and volume Maxlinear Inc
| Date |
Closing |
Open |
Range |
Volume |
Mon 20 October 2025 |
17.64 (3.95%) |
17.05 |
17.05 - 17.75 |
0.7377 times |
Fri 17 October 2025 |
16.97 (-2.86%) |
17.15 |
16.80 - 17.47 |
0.7862 times |
Thu 16 October 2025 |
17.47 (0.4%) |
17.77 |
17.17 - 17.80 |
0.8283 times |
Wed 15 October 2025 |
17.40 (3.08%) |
17.32 |
16.66 - 17.48 |
1.4053 times |
Tue 14 October 2025 |
16.88 (7.11%) |
15.22 |
15.07 - 17.83 |
1.8725 times |
Mon 13 October 2025 |
15.76 (9.98%) |
15.29 |
14.95 - 16.09 |
0.8973 times |
Fri 10 October 2025 |
14.33 (-10.21%) |
15.95 |
14.25 - 16.05 |
1.4486 times |
Thu 09 October 2025 |
15.96 (-1.66%) |
16.19 |
15.70 - 16.28 |
0.4605 times |
Wed 08 October 2025 |
16.23 (4.11%) |
15.64 |
15.58 - 16.30 |
0.5662 times |
Tue 07 October 2025 |
15.59 (-6.31%) |
16.79 |
15.34 - 16.85 |
0.9973 times |
Mon 06 October 2025 |
16.64 (1.16%) |
16.72 |
16.42 - 17.08 |
0.7689 times |
Weekly price and charts MaxlinearInc Strong weekly Stock price targets for MaxlinearInc MXL are 17.35 and 18.05 | Weekly Target 1 | 16.78 | | Weekly Target 2 | 17.21 | | Weekly Target 3 | 17.48 | | Weekly Target 4 | 17.91 | | Weekly Target 5 | 18.18 |
Weekly price and volumes for Maxlinear Inc
| Date |
Closing |
Open |
Range |
Volume |
Mon 20 October 2025 |
17.64 (3.95%) |
17.05 |
17.05 - 17.75 |
0.1805 times |
Fri 17 October 2025 |
16.97 (18.42%) |
15.29 |
14.95 - 17.83 |
1.4168 times |
Fri 10 October 2025 |
14.33 (-12.89%) |
16.72 |
14.25 - 17.08 |
1.038 times |
Fri 03 October 2025 |
16.45 (2.24%) |
16.33 |
15.60 - 17.12 |
1.062 times |
Fri 26 September 2025 |
16.09 (-0.62%) |
16.19 |
15.41 - 17.19 |
0.9186 times |
Fri 19 September 2025 |
16.19 (2.79%) |
15.76 |
15.61 - 17.04 |
1.246 times |
Fri 12 September 2025 |
15.75 (0.77%) |
15.82 |
15.51 - 16.53 |
1.1251 times |
Fri 05 September 2025 |
15.63 (-0.57%) |
15.14 |
15.04 - 16.03 |
0.8973 times |
Fri 29 August 2025 |
15.72 (0%) |
16.50 |
15.64 - 16.54 |
0.2091 times |
Fri 29 August 2025 |
15.72 (-3.85%) |
16.33 |
15.64 - 17.43 |
1.9066 times |
Fri 22 August 2025 |
16.35 (6.93%) |
15.31 |
13.91 - 16.43 |
1.5107 times |
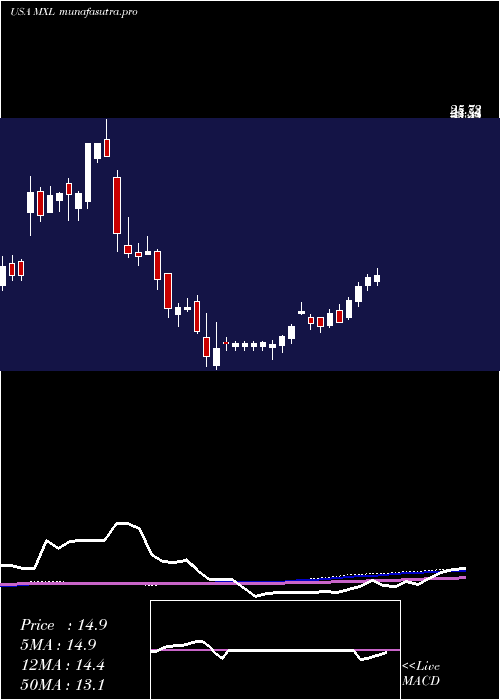
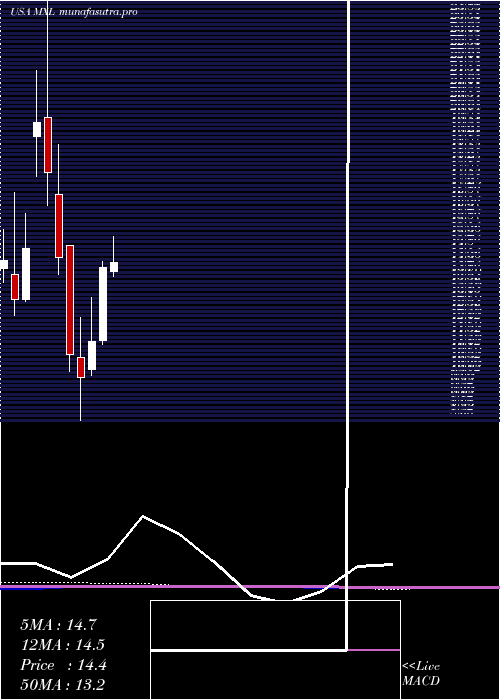
Monthly price and charts MaxlinearInc Strong monthly Stock price targets for MaxlinearInc MXL are 15.95 and 19.53 | Monthly Target 1 | 12.99 | | Monthly Target 2 | 15.32 | | Monthly Target 3 | 16.573333333333 | | Monthly Target 4 | 18.9 | | Monthly Target 5 | 20.15 |
Monthly price and volumes Maxlinear Inc
| Date |
Closing |
Open |
Range |
Volume |
Mon 20 October 2025 |
17.64 (9.7%) |
15.92 |
14.25 - 17.83 |
0.5364 times |
Tue 30 September 2025 |
16.08 (2.29%) |
15.14 |
15.04 - 17.19 |
0.7544 times |
Fri 29 August 2025 |
15.72 (-0.63%) |
15.30 |
13.91 - 17.43 |
1.0279 times |
Thu 31 July 2025 |
15.82 (11.33%) |
14.05 |
13.86 - 20.00 |
1.2463 times |
Mon 30 June 2025 |
14.21 (24.76%) |
11.41 |
11.26 - 14.44 |
0.6929 times |
Fri 30 May 2025 |
11.39 (14.01%) |
10.30 |
10.07 - 13.05 |
0.7371 times |
Wed 30 April 2025 |
9.99 (-8.01%) |
10.74 |
8.35 - 12.30 |
1.1681 times |
Mon 31 March 2025 |
10.86 (-25.67%) |
15.04 |
10.21 - 15.04 |
0.9668 times |
Fri 28 February 2025 |
14.61 (-18.2%) |
17.00 |
13.94 - 18.92 |
1.2373 times |
Fri 31 January 2025 |
17.86 (-9.71%) |
19.98 |
16.61 - 25.73 |
1.6328 times |
Tue 31 December 2024 |
19.78 (32.4%) |
19.26 |
17.71 - 21.78 |
0.6996 times |
DMA SMA EMA moving averages of Maxlinear Inc MXL
DMA (daily moving average) of Maxlinear Inc MXL
| DMA period | DMA value | | 5 day DMA | 17.27 | | 12 day DMA | 16.44 | | 20 day DMA | 16.33 | | 35 day DMA | 16.2 | | 50 day DMA | 16.08 | | 100 day DMA | 15.14 | | 150 day DMA | 13.79 | | 200 day DMA | 14.8 | EMA (exponential moving average) of Maxlinear Inc MXL
| EMA period | EMA current | EMA prev | EMA prev2 | | 5 day EMA | 17.12 | 16.86 | 16.81 | | 12 day EMA | 16.68 | 16.5 | 16.41 | | 20 day EMA | 16.47 | 16.35 | 16.29 | | 35 day EMA | 16.24 | 16.16 | 16.11 | | 50 day EMA | 16.13 | 16.07 | 16.03 |
SMA (simple moving average) of Maxlinear Inc MXL
| SMA period | SMA current | SMA prev | SMA prev2 | | 5 day SMA | 17.27 | 16.9 | 16.37 | | 12 day SMA | 16.44 | 16.32 | 16.27 | | 20 day SMA | 16.33 | 16.3 | 16.26 | | 35 day SMA | 16.2 | 16.15 | 16.11 | | 50 day SMA | 16.08 | 16.03 | 16 | | 100 day SMA | 15.14 | 15.09 | 15.03 | | 150 day SMA | 13.79 | 13.76 | 13.73 | | 200 day SMA | 14.8 | 14.81 | 14.82 |
|
|
